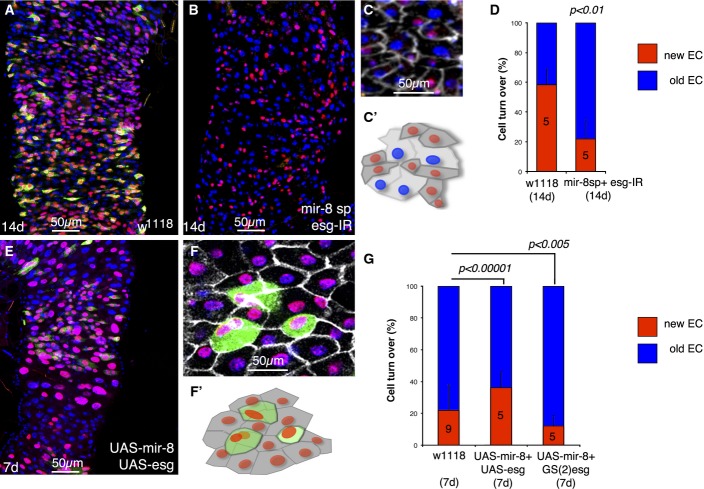
Figure 4.
Loss and gain of mir-8-induced intestinal precursor cell defects are rescued by loss and gain of escargot
- Control wild-type midgut 14 days after the temperature shift.
- Illustrative example of a midgut of 14 days with depleted mir-8 and escargot simultaneously (esgReDDM > mir-8-sp+esg-IR). Note that after 2 weeks, the pool of esg+ cells is completely depleted and no further renewal could be done.
- Dlg-1 staining (grey) illustrates that cells that turned off esg+ (GFP− RFP+ cells) are integrated into the epithelium (precociously differentiated enterocytes) and scheme below (C′).
- Graph shows quantification of replenishment (% of new EC, GFP− RFP+ cells) of control (w1118; esgReDDM >) and mutant esgReDDM > mir-8-sp+esg-IR midguts at the indicated time point. Error bars represent SD.
- Co-overexpression of mir-8 and escargot (esgReDDM > UAS-mir-8+UAS-esg) rescued in part the premature terminal differentiation, and after 7 days, esg+ undifferentiated cells are still seen.
- Dlg-1 staining (grey) in UAS-mir-8+UAS-esg midgut. Note the large size and rounded shaped of esg+ (GFP+) cells. (F′) is a scheme of (F).
- Graph shows quantification of the indicated genotypes at the indicated time point. The number of guts (n) scored is indicated in the graphs and statistical significance using ANOVA are shown. In the esgReDDM > UAS-mir-8+GS(2)esg genotype, most esg+ cells failed to terminally differentiate, further reflecting the phenotype involves a balance between miR-8 and escargot. Shown are representative images.
Source data are available online for this figure.

