
Figure 5.
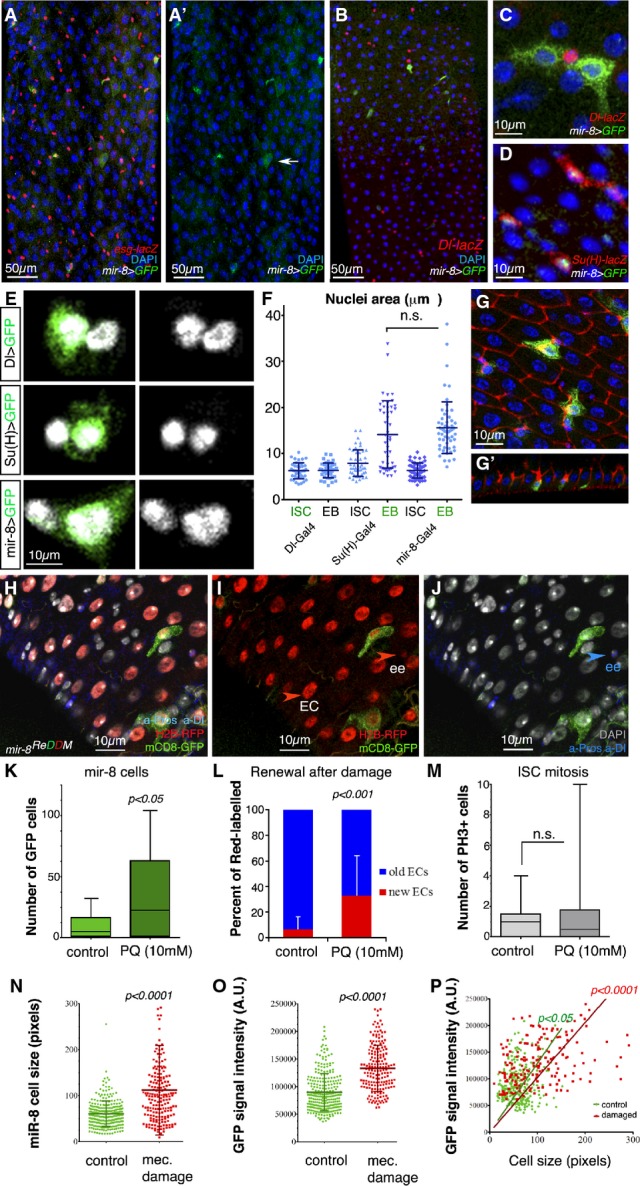
Endogenous microRNA mir-8 is readily activated in late-stage enteroblasts before terminal differentiation
- A–D Representative confocal images and single-channel image (A′) of an adult mir-8-Gal4 enhancer trap midgut stained with antibodies against GFP and esg-lacZ (A), the ISC marker Dl-lacZ (B, C) and the enteroblast marker Su(H)-lacZ (D). Note that in (D) GFP is nuclear (mir-8 > GFPnls GBE-Su(h)-lacZ).
- E mir-8+ cells are late-stage enteroblasts (as deduced by their large polyploid nuclei).
- F Histogram of the quantification of the nuclear size (μm2) of DAPI-stained GFP+ cells driven by the indicated Gal4 lines and that of neighbouring non-GFP cells. The data are represented as the mean ± SD. There are no statistically significant differences in GFP and non-GFP labelled cells in Dl-Gal4 and GBE-Su(H)-Gal4 midguts (t-test, n = 45 and 47 for each genotype).
- G Tangential confocal sections show that mir-8+ enteroblasts (green) are integrating into the epithelium (outlined by Dlg-1, in red, and note Dlg-1 accumulation).
- H–J Lineage tracing of mir-8-Gal4 enteroblasts using ReDDM shows that both enterocytes and enteroendocrine cells (ee: red-retaining, Pros+) are derived from mir-8+ progenitor cells. Old ee cells are detected as Pros-positive cells (nuclear staining). DAPI staining in grey, while cytoplasmic Dl staining marks ISCs (white arrowhead).
- K, L (K) Histogram of number of mir-8+ cells in midguts after 4 h of Paraquat (PQ)-ingestion and sibling control and (L) quantification of ratio of cell turnover (red-only cells/old cells (DAPI) in the same midguts as (K) (n = 13 and 12 WT and damaged midguts scored, respectively). Error bars represent SD.
- M Quantification of mitotic ISCs assessed by labelling with PH3 (n = 13 and 12 of each condition). Error bars represent SD.
- N, O Scatter dot plots showing average cell size (n) and average pixel (GFP) intensity signal (O: mean value per cell, arbitrary units, A.U.) with population mean and standard deviation. Number of cells counted, n = 280 in wild-type guts, and n = 188 in damaged guts.
- P Linear regression analysis of GFP signal and cell size from the same data as in (N, O). Best fitting line with (0;0) origin is shown for both populations.
Source data are available online for this figure.