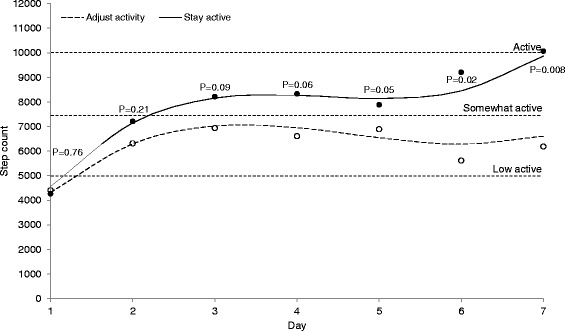
Fig. 2.

Modeled daily step count over the 7 days follow-up in patients with ALBP. Solid line represents patients advised to stay active (SA) and dashed line patients advised to adjust activity (AA) to the pain; horizontal lines are cut-offs for daily step count levels; p-values indicate statistical difference between groups of modeled values; circles indicate mean of observed step count (SA = filled, AA = open)
