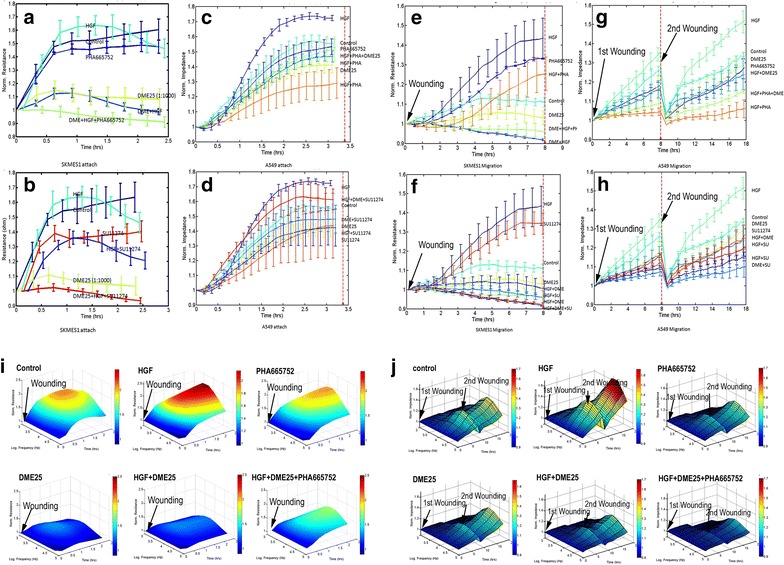
Fig. 4.

ECIS based tracking cell adhesion (a, b, c, d) and cell migration (e, f, g, h) for both SKMES1 (a, b, e, f) and A549 (c, d, g, h). i, j 3D modelling was used to display the response of cell migration over frequencies ranging from 1000 to 64,000 Hz. The experimental conditions for both adhesion and migration are similar to that in Fig. 2. a, b Adhesion of SKMES1 cells. HGF increased the migration, which was blocked by inclusion of DME25 and in particular by the combination of both DME25 and PHA665752 (a) and SU11274 (b). c, d: Adhesion of A549 cells. HGF had a marked effect on the adhesion of the cells, which was similarly reduced by DME25 and the cMET small inhibitors PHA665752 (c) and SU11274 (d). e, f Migration of SKMES1 cells following electric wounding. DME25, PHA665752 (e) and SU11274 (f) had a marked inhibitory effect on HGF induced cell migration. g, h Migration of A549 in a similar layout to (e, f), except the cell layer was wounded twice (at the beginning and after 8 h. i Adhesion of SKMES1 cells as demonstrated using a 3-dimensional model. The test was automatically carried out over a range of frequencies (1000 to 64,000 Hz). The inhibitory effect was seen across the range of frequencies applied in the study. J Migration of A549 cells shown in 3-D model. The A549 cells were wounded at the beginning and after 8 h. Wounding condition was 2wounded. y-axis: resistance (ohms); x-axis: frequencies in Hz; z-axis: time in hours. The concentrations of the test agents used here were the same as in Fig. 3
