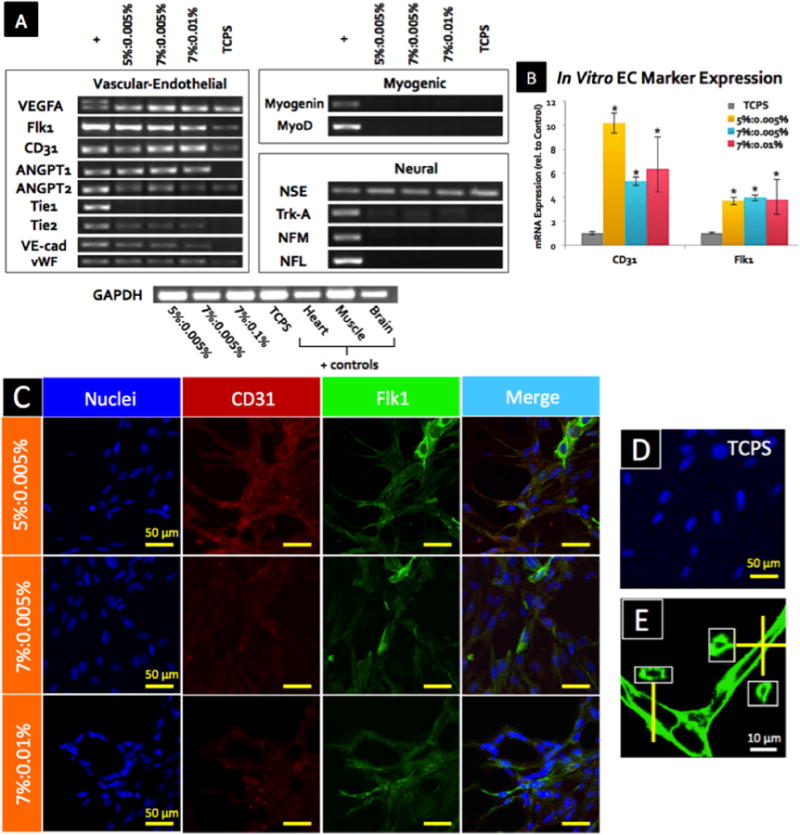
Figure 4.

(A) Expression for vascular-endothelial, myogenic, and neural lineage markers in MSCs was determined from mRNA after 15 days of culture in GHPA gels by RT-PCR. + indicates positive controls from heart (vascular-endothelial), skeletal muscle (myogenic), and brain (neural) tissues, while TCPS indicates control MSCs cultured on on tissue culture poly styrene. (B) Expression for endothelial cell markers CD31 and Flk1 in MSCs was determined from mRNA after 15 days of culture in GHPA gels by qRT-PCR with N=3 and error bars = ±1 SEM. * indicates p<0.05 in comparison to the control MSCs on tissue culture plate. (C) CD31, Flk1 and nuclei were stained and imaged after 15 days of culture in GHPA gels, and a merged image for the TCPS control is shown in (D). Z-stacked confocal images are shown in (C). (E) F-actin staining of MSCs after 15 days of culture in 7%:0.005% condition showed clear lumen formation. Insets contain orthogonal views.
