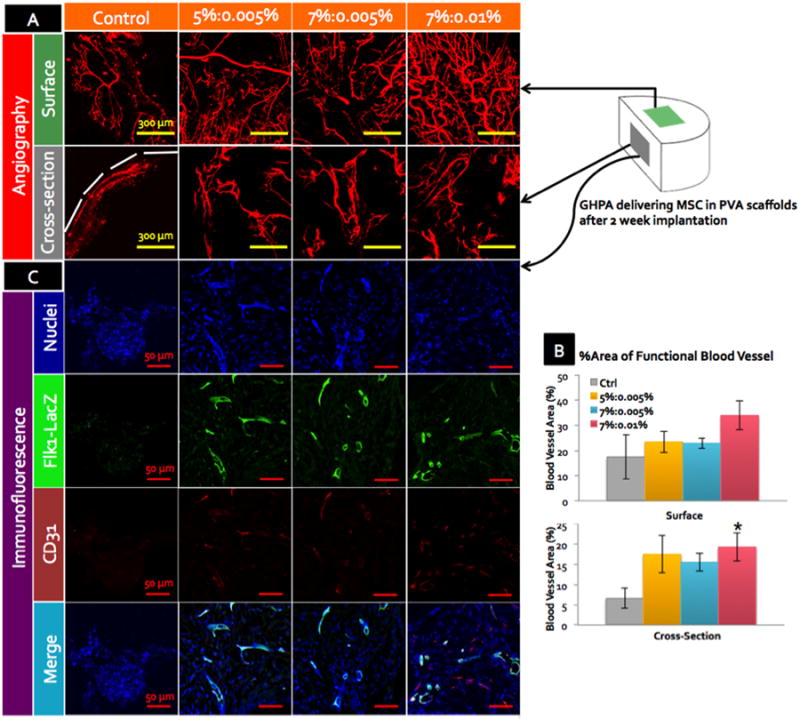
Figure 6.

(A) Angiograms of the harvested scaffolds by perfusion with fluorescent microbeads at 2 weeks post implantation. Representative images from the outer surface and cross-sections are shown with scale bars = 300 μm. White dotted line marks the boundaries of the scaffolds. (B) % area of the functional blood vessels by angiograms in (A) with error bars = ±1 SEM and N=4. * indicates statistical significance with p < 0.05 in comparison to the control. (C) CD31, LacZ and nuclei staining of the cross-sections of the explanted scaffolds with scale bars = 50 μm. All images were acquired by confocal microscopy, and z-stacked.
