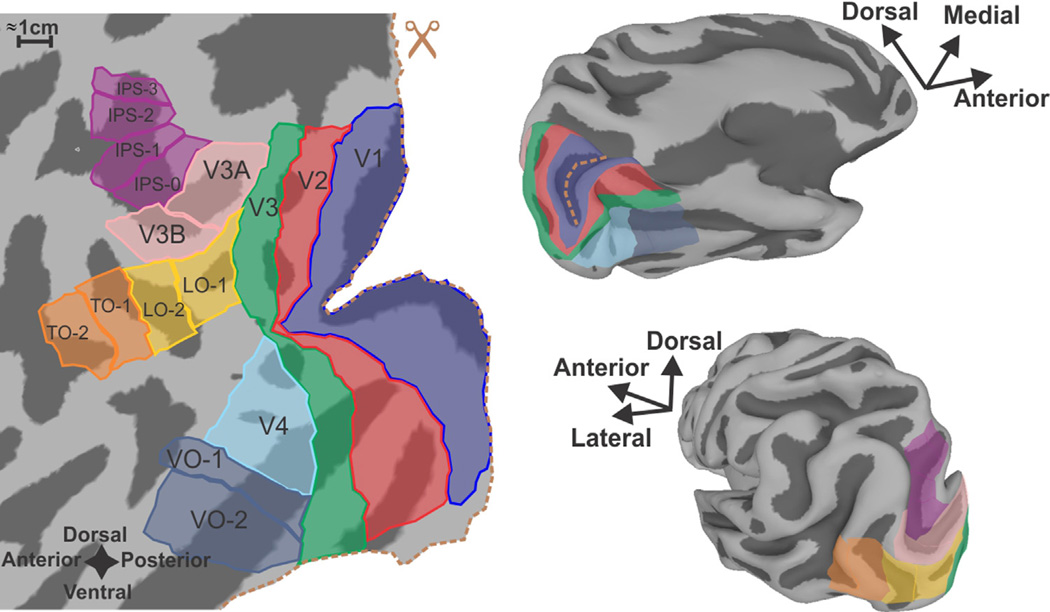
Figure 1.
Subdivisions of the human visual cortex displayed on cortical surface models of an individual subject. At left is a cortical flat map created by computationally unfolding the occipital lobe portion of the 3D surface model shown on the right. (Dotted orange line along the right margin of the flat map marks edges of a computational “cut” along the fundus of the calcarine sulcus, which is shaded navy blue on the upper 3D model. The cut allows the surface to unfold with less distortion.) Dark gray zones on all models represent the interior of sulci. Colored patches mark approximate locations of functionally distinct visual areas. Primary visual cortex (a.k.a. VI, striate cortex)—navy blue. V2—red. V3—green. V4—light blue. Ventral occipital complex80—blue-gray. Lateral occipital complex39,81—yellow. Temporal Occipital complex (a.k.a. hMT+, MST)80—orange. V3A/B18–22—pink. IPSO (a.k.a. V7); IPS1-382–83—magenta. It should be noted that the region in and around the VO complex may be composed of multiple visual areas such as the visual word-form area50 and the fusiform face area46 defined differently by other investigators. (Color version of figure is available online.)

