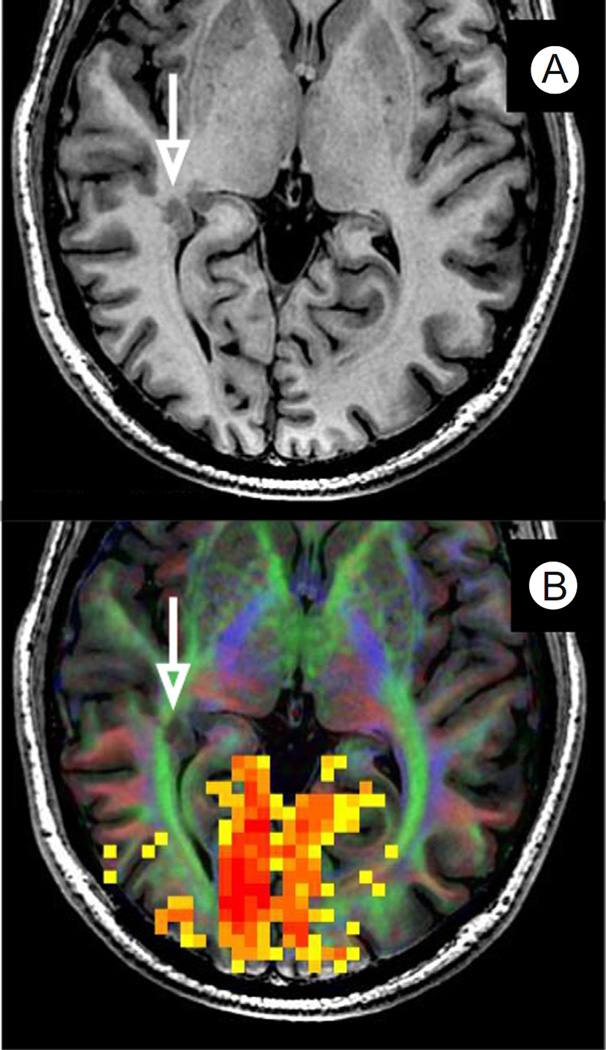
Figure 6.
fMRI visual mapping in a patient with gray matter heterotopia. (A) A T1-weighted axial anatomical image showing gray matter heterotopia (white arrow) in an epileptic patient with poorly controlled seizures. (B) A DTI tractography orientation map (colored white matter) shows that the heterotopia extends into the adjacent optic radiations (green) that provide the retinal sensory input, driving the visually driven fMRI activation (red or yellow voxels) in the same hemisphere. The heterotopia was not targeted for resection. See text for outcome and additional case details. (Color version of figure is available online.)

