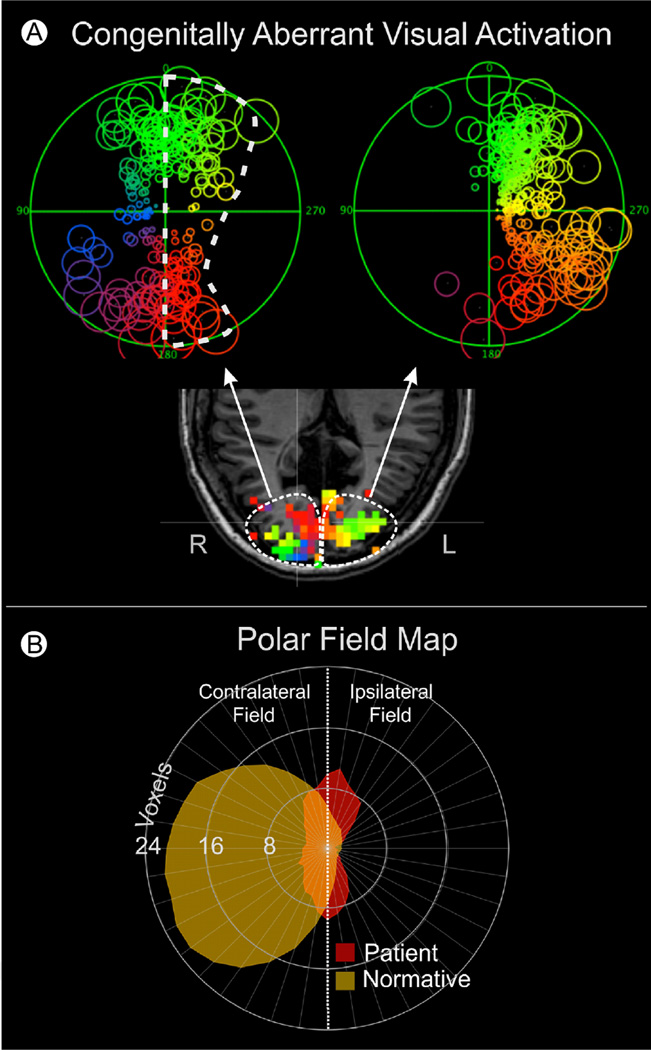
Figure 7.
Congenitally aberrant visual cortex activation in a patient with childhood hydrocephalus. (A) Functional Field Maps computed from fMRI activation of each hemisphere separately. The FFMap at the right of the figure was computed from the left hemisphere and consists of a normal hemifield representation (but with some loss in the upper right quadrant). In contrast, the FFMap at the left of the figure was computed from the right hemisphere and shows a very reduced representation of the normal contralateral (left) visual field but a highly expanded, yet aberrant, representation of the ipsilateral (right) visual field (surrounded by white dashed outline). (B) Quantitative comparison of this patient's right hemisphere representation of the visual field (red) with the average right hemisphere representation for a group of healthy control subjects (yellow). Each data point on the circumference of such a polar field map represents the number of visually active voxels contained within a thin radial “pie wedge” of visual field extending radially at the same angle as the data point. For example, approximately 22 voxels (between 16 and 24) were found to represent the left horizontal meridian of healthy subjects, whereas the patient data yielded approximately 4 voxels. It should be noted that for normal, healthy subjects, very few voxels in the right hemisphere represent the ipsilateral field (to the right of the vertical meridian). However, for this patient, nearly half of the voxels in the right hemisphere represent the ipsilateral field. (Adapted with permission from Reitsma et al.63) (Color version of figure is available online.)

