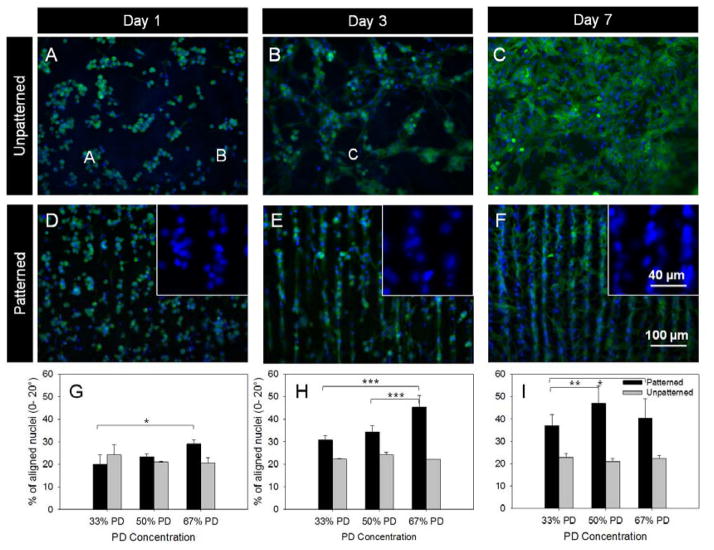
Figure 3.
CM culture and nuclei alignment quantification. Fluorescent images of CMs fixed and stained with phalloidin (F-actin filaments, green) and DAPI (nuclei, blue) on unpatterned (A–C) and patterned (D–F) 67% PD hydrogels showed increased spreading and elongation from day 1 through to day 7. Insert images in D–F show the elongation of nuclei towards the channel directions over time. The orientation of the nuclei with respect to channel direction were quantified for the three timepoints respectively. The orientation of nuclei were equally distributed for unpatterned samples but showed an increase in orientation towards channel directions over time. *p< 0.05, ** p < 0.01 and *** p < 0.001, n =3, error bars denote standard deviation..

