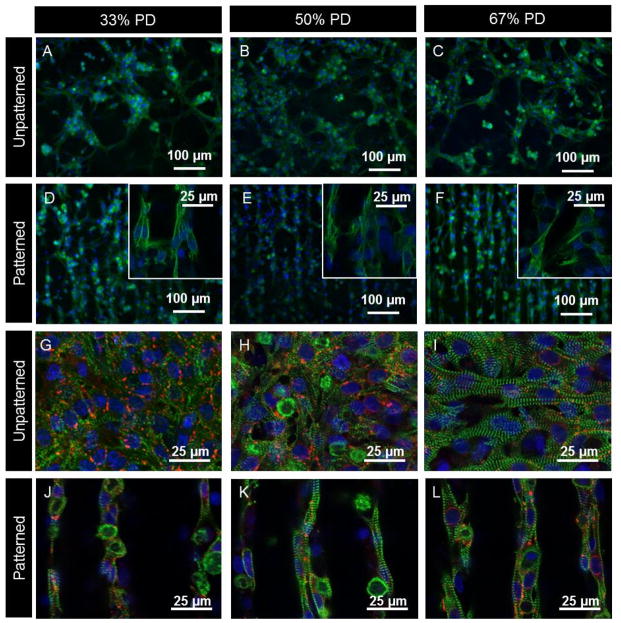
Figure 4.
Fluorescent micrographs comparing the effects of PD concentration and patterning on CM alignment and distribution. Figure A–F show epifluoresence images of day 7 CM fixed and stained with DAPI (blue) which stains the nuclei, and troponin I antibody (green) present in CM. Inserts in images D–F show higher magnification regions obtained via confocal microscopy showing cell-cell contact between adjacent channels. Figures G–L show confocal images of day 7 CM fixed and stained with DAPI (blue), connexin 43 (red) and sarcomeric α-actinin (green) which stains for the striated Z-lines of myotubes in cardiac muscle. Image plane is focused on cells at the top of the channels.

