Figure 5.
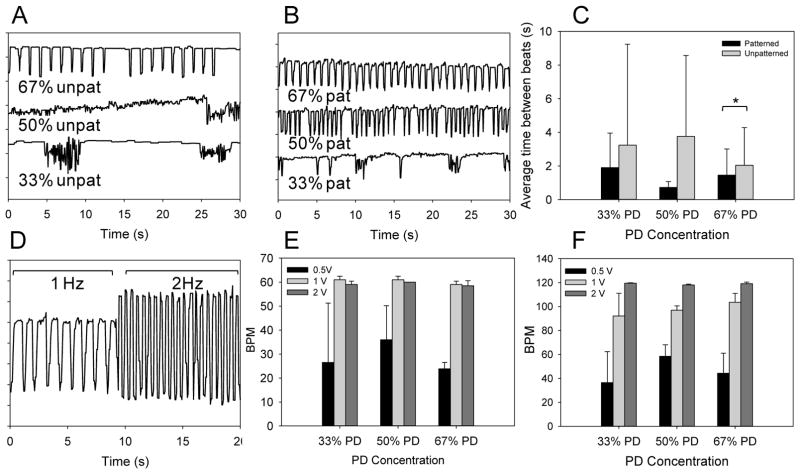
CM Beating characterization. Beating characteristics of day 4 CMs seeded on unpatterned (A) and patterned substrates (B) across different compositions are represented by monitoring pixel intensity in regions of interests over a period of 30 s. The average time between beats and beat homogeneity are compared (C) between patterned and unpatterned substrates. * denotes statistical significance from t-tests comparing means between patterned and unpatterned conditions, p< 0.05. D. Representation of CM beating on patterned 67% PD substrate on day 6 in response to an externally applied electric field at 1 and 2 Hz. The measured BPM of CM was quantified on patterned substrates at 0.5, 1.0 and 2.0 volts at input frequency of 1 Hz (E) and 2 Hz (F), error bars indicate standard deviation. As input voltage increased the BPM of CMs increased towards the desired frequency.

