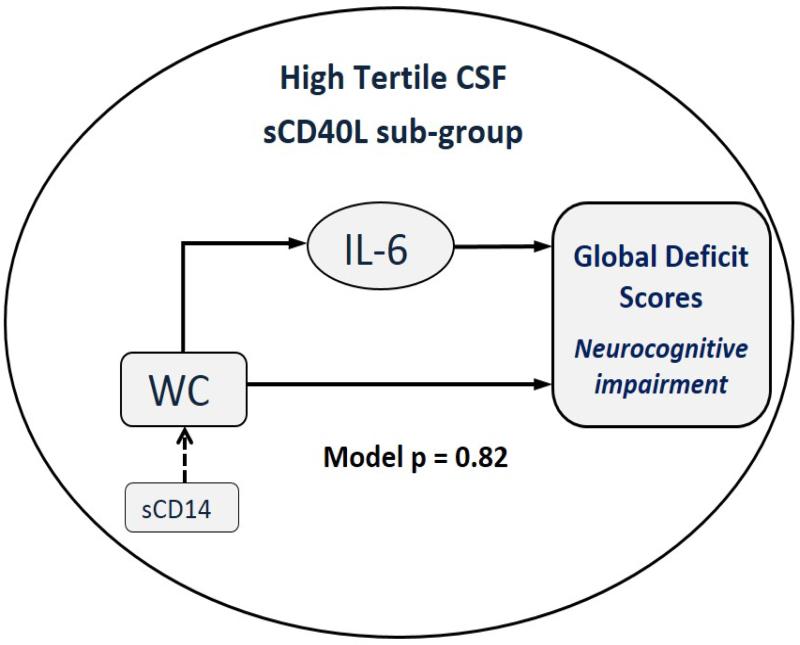
Figure 2.
Figure depicts the model derived from path analysis and regression coefficients linking waist circumference (WC) to global deficit scores (GDS) in patients with high CSF levels of sCD40L. Solid lines represent regression coefficients each with p<0.05 and arrows show the direction of the relationship. For sCD14, p=0.07 and is an interaction term with waist circumference (WC). The Path analysis generated the following relationship:
1. Log (IL-6)=0.011*WC: 10cm increase in WC => 12% increase in IL-6 (exp[0.011*10]=1.116=111.6%)
2. WC = 0.006*sCD14 (in 1000): 100,000 increase in sCD14 => 0.6cm increase in WC
3. Sqrt (GDS) = 0.005*WC + 0.28*log(IL-6).
In the top pathway, WC is a predictor of GDS and its effects are mediated by IL-6. In the lower pathway, WC is direct predictor of GDS. In Path analysis, higher P values reflect better fit of data to the model and, thus, this is a strong model since p=0.82.

