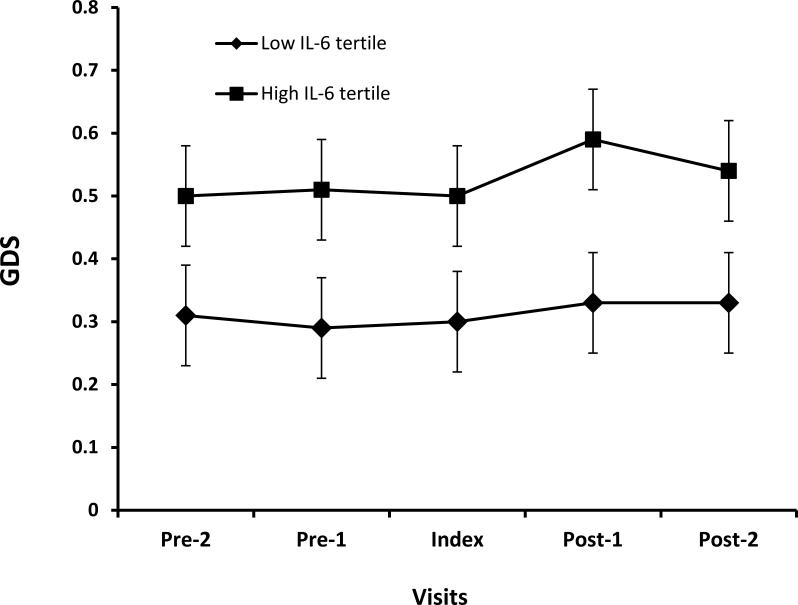
Figure 3.
Figure shows change in Global Deficit Score (GDS) Over Time in High and Low IL-6 tertiles. Pre-2 and Pre-1 are CHARTER visits at -12 and -6 months before the index visit, respectively. Post-1 and Post-2 are visits 6 and 12 months, respectively, after the index visit when IL-6 was measured. The lines with boxes are GDS values for subjects with IL-6 in high tertile and line with diamonds are for subjects in low IL-6 tertile. The average difference in GDS over time between the two groups is 0.22 (p=0.02).

