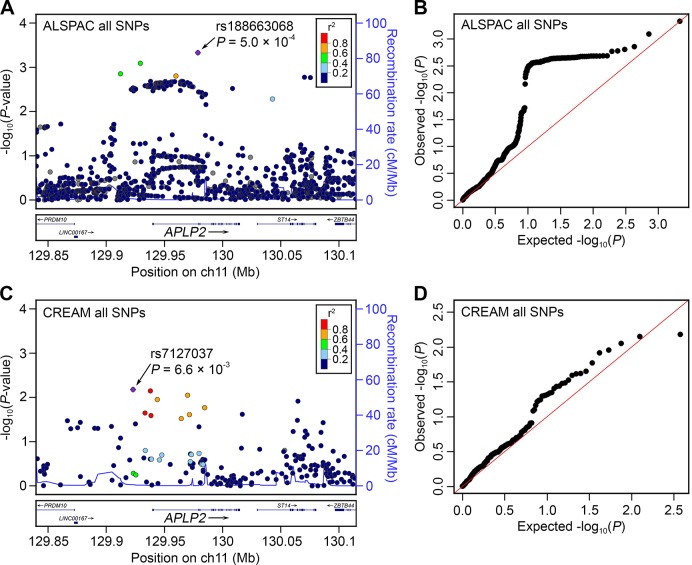
Fig 2. Association between genetic variants at the APLP2 locus and refractive error in children and adults.
The y-axis of all graphs indicates the observed log10 (P-values) for single-marker association tests from GWAS for refractive error, for SNPs within 100 kb of the APLP2 gene in children (n = 3,819) participating in the ALSPAC study (A, B) and adults (n = 45,756) participating in the CREAM consortium sample (C, D). Region plots for all SNPs examined (A, C) show genomic position on the x-axis (build hg19 coordinates) while the colour coding indicates LD (r2) with the lead SNP estimated from CEU individuals in HapMap Phase 2, and the right-hand y-axis indicates the recombination rate. Quantile-quantile plots (B, D) display expected log10 (P-values) on the x-axis.

