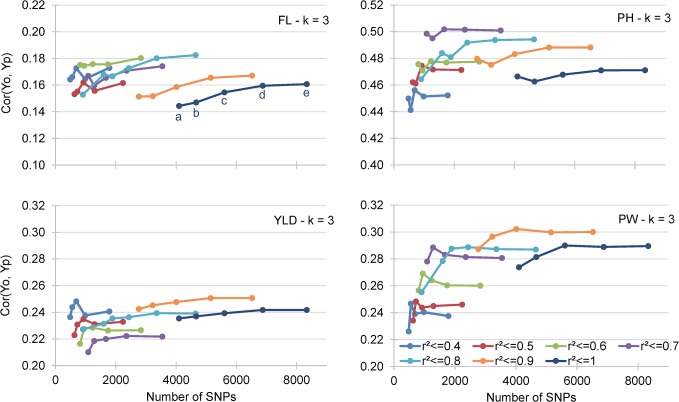
Fig 5. Mean correlation between GEBV obtained by cross validation of the training data set (Yp) and the observed BLUP values of the validation data sets (Yo).
The results for days to flowering (FL), plant height (PH), panicle weight (PW) and grain yield (YLD) and 35 incidence matrices are presented.

