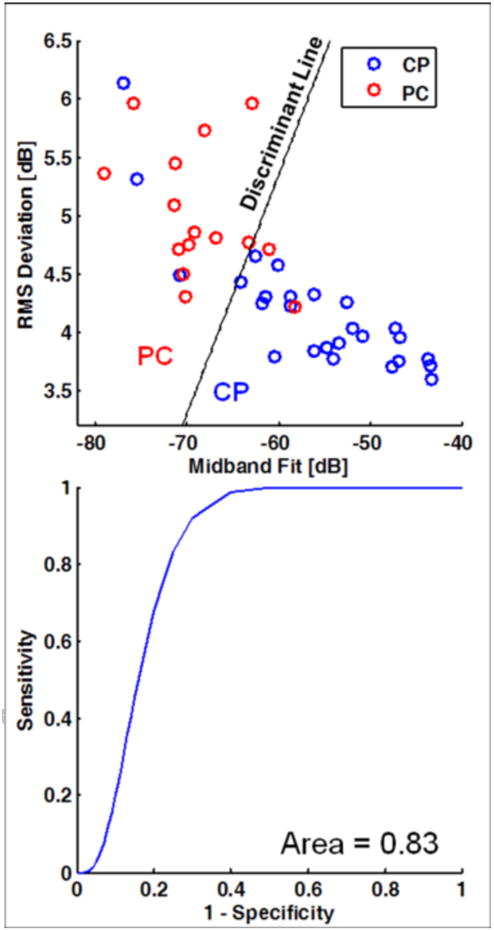
Figure 3. Linear discriminant analysis and receiver operating characteristic (ROC) curve for the diseased pancreas data.

(A) Scatterplot of data with coordinates given by midband fit and RMS deviation. The dividing lines for the classification of pancreatic cancer (PC) vs. chronic pancreatitis (CP) are based on linear discriminant analysis. (B) Corresponding binormal maximum likelihood estimate of the ROC curve. The area under the curve is 0.83. (See Table 3 for the corresponding classification matrix.)
