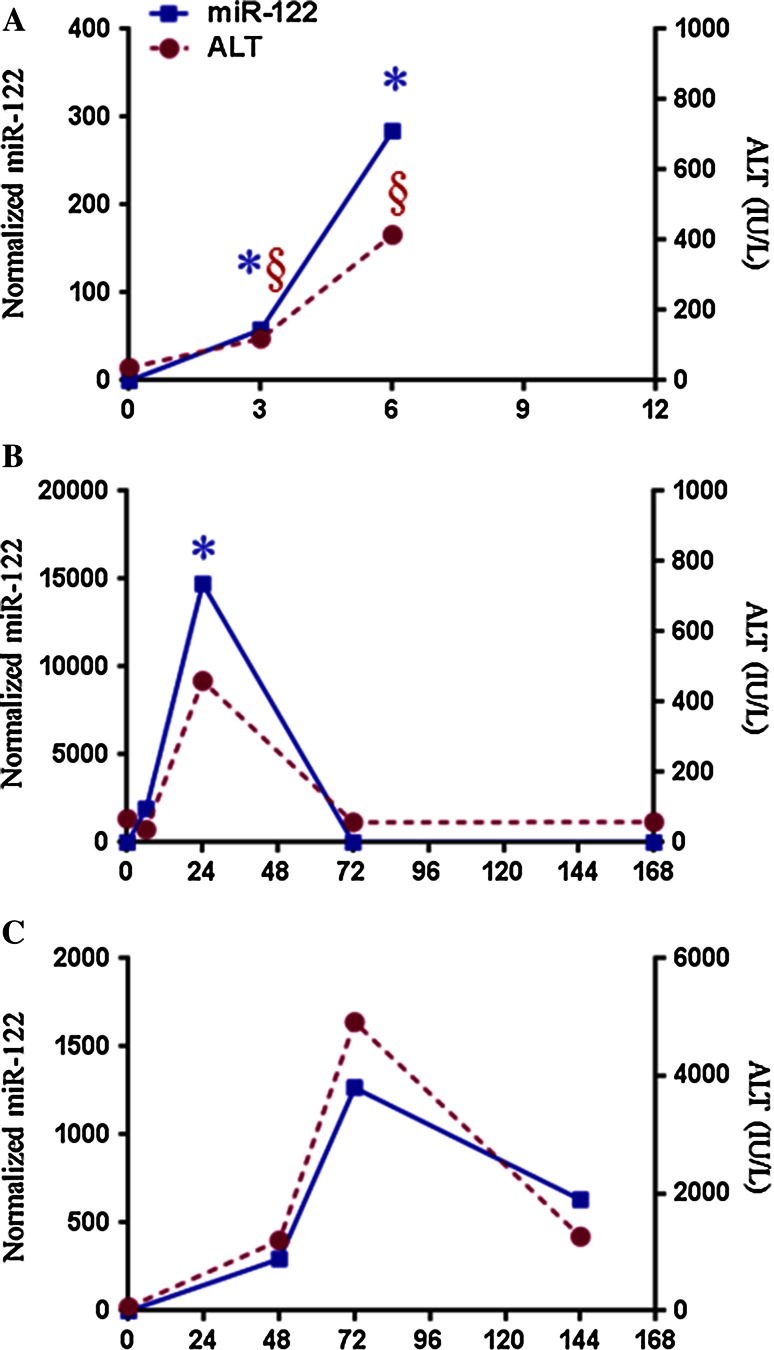
Fig. 4.
Plots showing time response of serum miR-122 versus ALT in a mice dosed with 500 mg/kg (approximation of Fig. 3b, c in Bala et al. 2012), b rats dosed with 1250 mg/kg APAP (Yang 2012a; unreported data) and c human APAP overdose patient (Yang et al. 2015). The miR-122 and ALT data shown at 0 h represent mean values of non-APAP-treated mice (a) or rats (b). Time 0 for figure c reflects mean values of parameters for non-APAP-treated children

