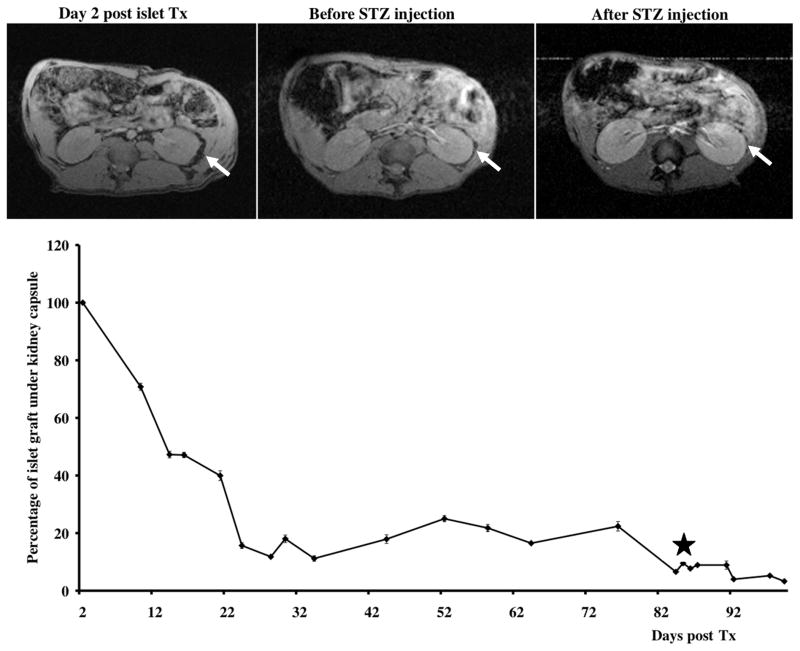
Figure 2.
Longitudinal MR imaging of autologous grafts. Top: Representative MR images of the autologous transplantation time course (arrows – transplant under the kidney capsule). Bottom: Semiquantitative assessment of graft longevity demonstrates notable drop in graft volume followed by STZ administration (star).

