
Figure 1.
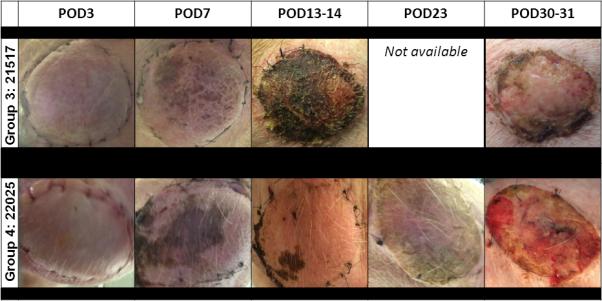
Gross appearance of VCA. Representative clinical images of VCAs from Group 3 animal #21517 (top row) and Group 4 animal #22026 (bottom row) by postoperative day. Animals in both groups showed patchy areas of necrosis starting on postoperative day 7 that progressed to epidermal sloughing.