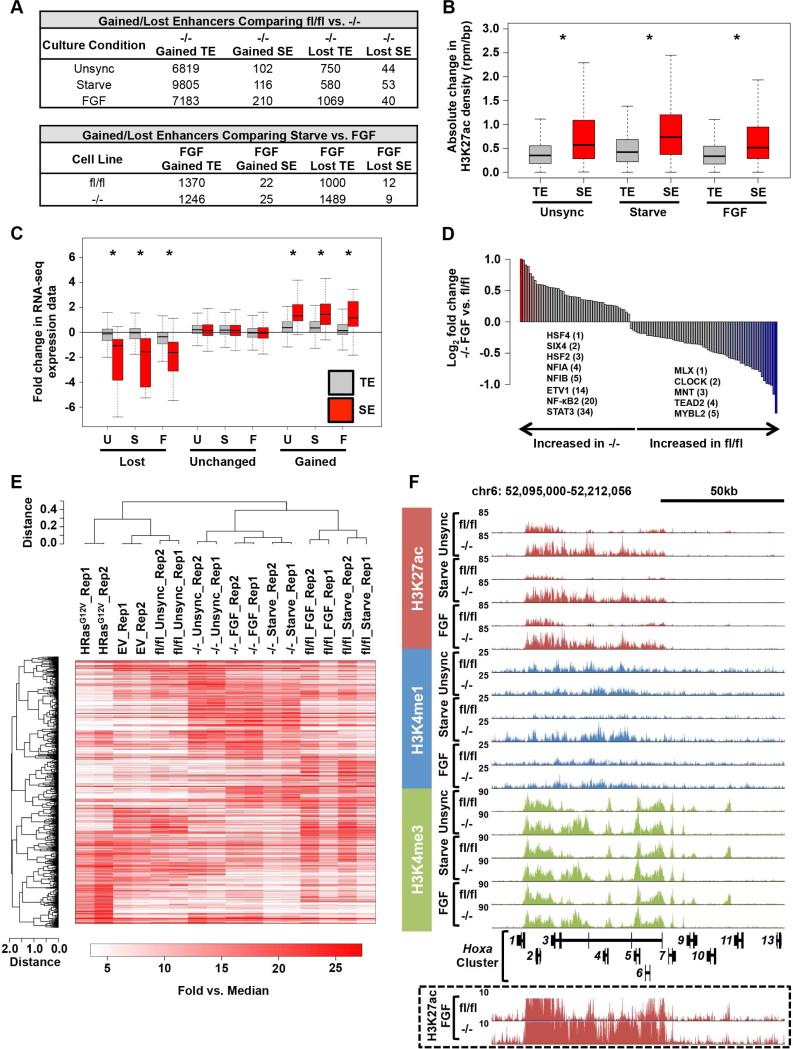
Figure 2. Spry loss globally reprograms enhancer-associated chromatin modifications.
(A) Table summarizing the number of H3K27ac defined enhancers significantly modulated between Spry124fl/fl and Spry124−/− MEFs in the indicated comparisons.
(B) Boxplot of the absolute change in H3K27ac density between Spry124fl/fl and Spry124−/− MEFs at TEs and SEs.
(C) Boxplot of RNA-seq expression for genes proximal to TEs and SEs that were gained, unchanged, or lost in Spry124−/− MEFs upon comparison between Spry124fl/fl and Spry124−/− MEFs under the indicated conditions.
(D) Bar plot of the ratio of TF motif density at gained Spry124−/− FGF SEs in the indicated comparison (p < 0.05). Colored bars represent TFs with p < 0.05 and fold change > 1.5. The fold change ranking of select TFs are indicated.
(E) Hierarchical clustering analysis of H3K27ac defined SE regions in the indicated MEFs. Each biological replicate (rep) is displayed.
(F) UCSC genome browser view of H3K27ac, H3K4me1, and H3K4me3 ChIP-seq binding density at the Hoxa cluster in Spry124fl/fl and Spry124−/− MEFs under the indicated culture conditions. H3K27ac binding density at an adjusted scale is depicted in the box.
n = 2 for (A-F). In (A-D) and (F) a representative biological replicate is shown. The p-values were calculated by a two-tailed t test; *p < 0.05.

