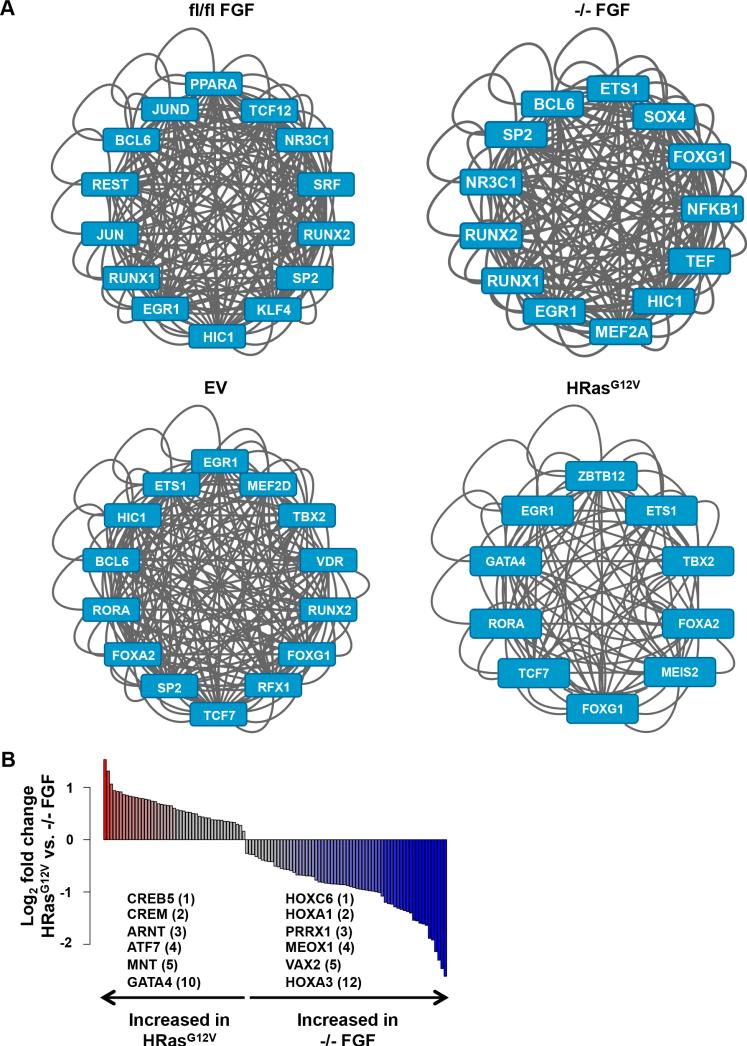
Figure 5. Spry loss and oncogenic HRasG12V modify distinct TF networks.
(A) The top ranking regulatory TF network identified at SEs in Spry124fl/fl FGF, Spry124−/− FGF, Spry124fl/fl EV, and Spry124fl/fl HRasG12V MEFs. Each TF depicted represents a node in the network.
(B) Bar plot of the ratio of TF motif density at gained HRasG12V SEs in the indicated comparison (p < 0.05). Colored bars represent TFs with p < 0.05 and fold change > 1.5. The fold change ranking of select TFs are indicated.
n = 2 for (A-B). In (A-B) a representative biological replicate is shown.

