FIG 4.
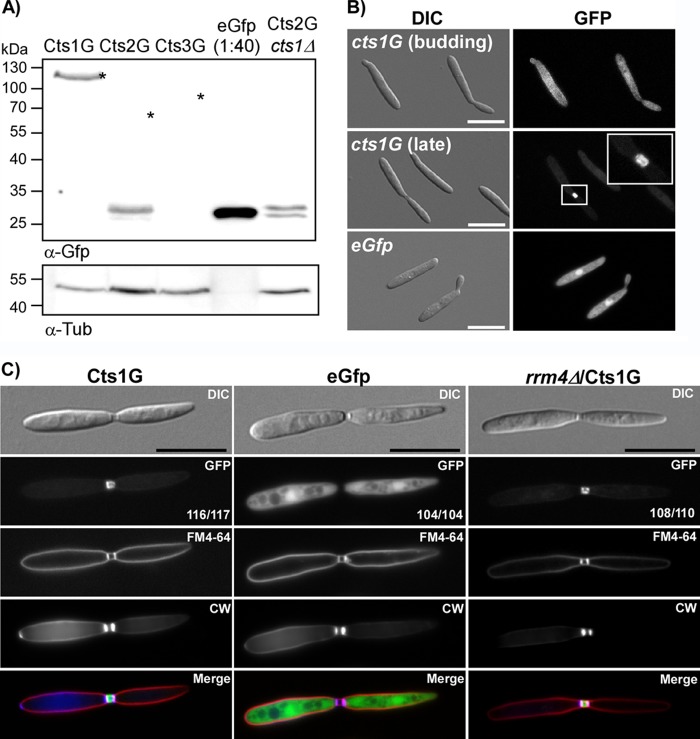
Subcellular localization of chitinases. (A) Western blot analysis of chitinase fusion proteins. Cts1G can be detected as a stable fusion protein at 120 kDa. Cts2G is expressed, but stable fusion protein cannot be detected. Instead, a signal at the size of free EGFP can be observed, indicating the expression of the protein. Cts2G also is degraded in the cts1D background. The Cts3G fusion protein is not detectable as either the full length or as a degradation product. An asterisk indicates the expected size of fusion protein. (B) Cts1G is distributed evenly in the cytosol in budding cells and accumulates in the fragmentation zone between mother and daughter cells during late cell division stages. (C) Cells with a fully established fragmentation zone were identified based on the differential interference contrast (DIC) image. Subsequently, the localization of the GFP signal was scored in at least 100 cells for each strain (numbers are indicated in the GFP image). Cts1G localizes to the fragmentation zone between mother and daughter cells in AB33 and also in rrm4Δ mutants, while free cytosolic EGFP is never found in this fragmentation zone. To visualize the limits of the fragmentation zone, septa were stained with CW and the plasma membrane with FM4-64. The quantification was repeated three times with similar results. Scale bars, 10 μm.

