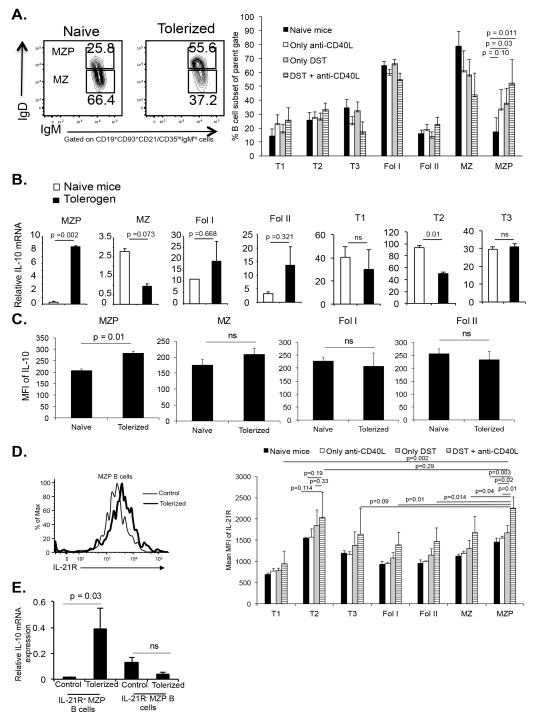
Figure 5. Costimulatory blockade increases MZP B cells and their IL-10 expression.
C57BL/6 mice given no treatment (naïve), DST, anti-CD40L or DST + anti-CD40L (tolerogen), and after 5 days different subsets of B cells from spleen were analyzed. (A) Contour plots show the changes in MZP and MZ cells (left). B cell subset percentages (right) calculated based on gating scheme in Supplementary Figure S1A. 4 mice/group. (B) IL-10 mRNA expression assessed by qRT-PCR. Error bar is standard deviation. (C) Splenocytes (2 X 10⁶ cells/well) stimulated with PMA and ionomycin, intracellular IL-10 stained, and flow gated on various B cell subsets. 5 mice/group. (D) IL-21R expression analyzed on MZP and other B cell subsets. Representative histogram of IL-21R expression on MZP B cells (left). MFI of IL-21R expression on various subsets (right). 4 mice/group. (E) IL-21R+ and IL-21R− B cells purified from control or tolerized mice and IL-10 mRNA analyzed by qRT-PCR. Error bar is standard deviation.

