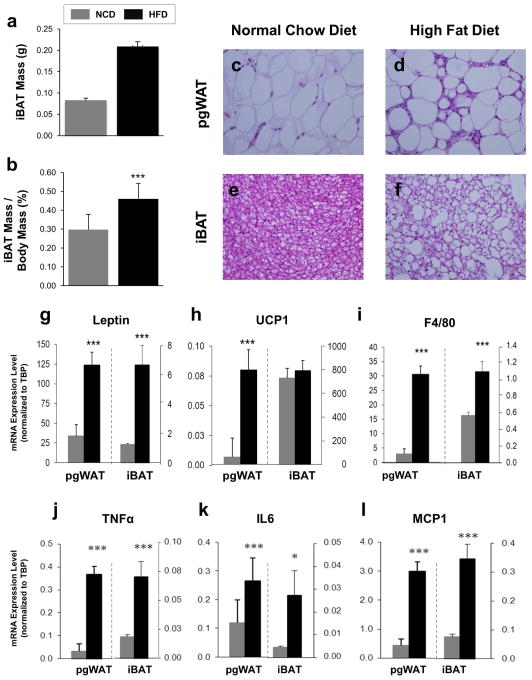
Figure 1. Effects of DIO on pgWAT and iBAT Anatomy and mRNA Expression.
(a) iBAT mass was recorded after sacrifice. (b) iBAT mass was normalized by dividing by whole body mass. Hematoxylin and eosin stained sections of perigonadal WAT from mice who ate (c) NCD or (d) HFD and iBAT from mice who ate (e) NCD or (f) HFD; shown at 400X magnification. mRNA expression analysis was performed on pgWAT and iBAT taken from C57BL/6J male mice fed NCD or HFD for 18 weeks. Expression levels are shown as averages normalized to TBP for the following genes (g) leptin; (h) UCP1; (i) F4/80; (j) TNFa; (k) IL6; (l) MCP1. n=12 per group. *P < 0.05, ***P < 0.001.

