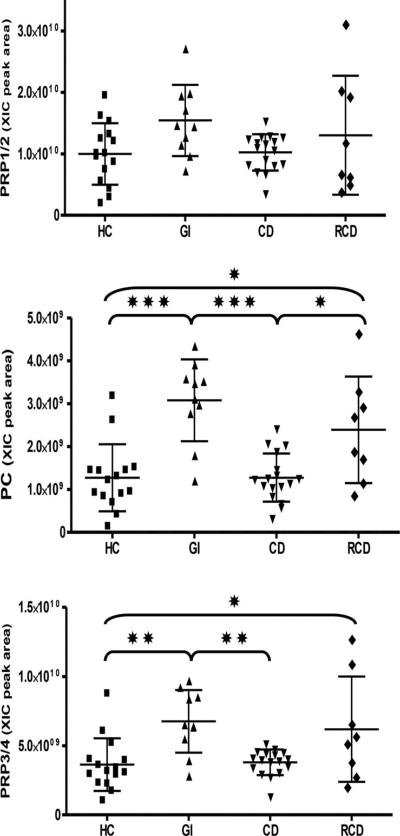
Figure 6.
Distribution of the XIC peak areas of the aPRPs in the four groups. Means ± SD of the XIC peak areas are reported on each diagram. Significant differences between pairs of the groups (one way ANOVA with Tukey's post hoc multiple comparison test) are represented by asterisks.*p ≤ 0.05, **p ≤ 0.01, ≤ ***p ≤ 0.001.

