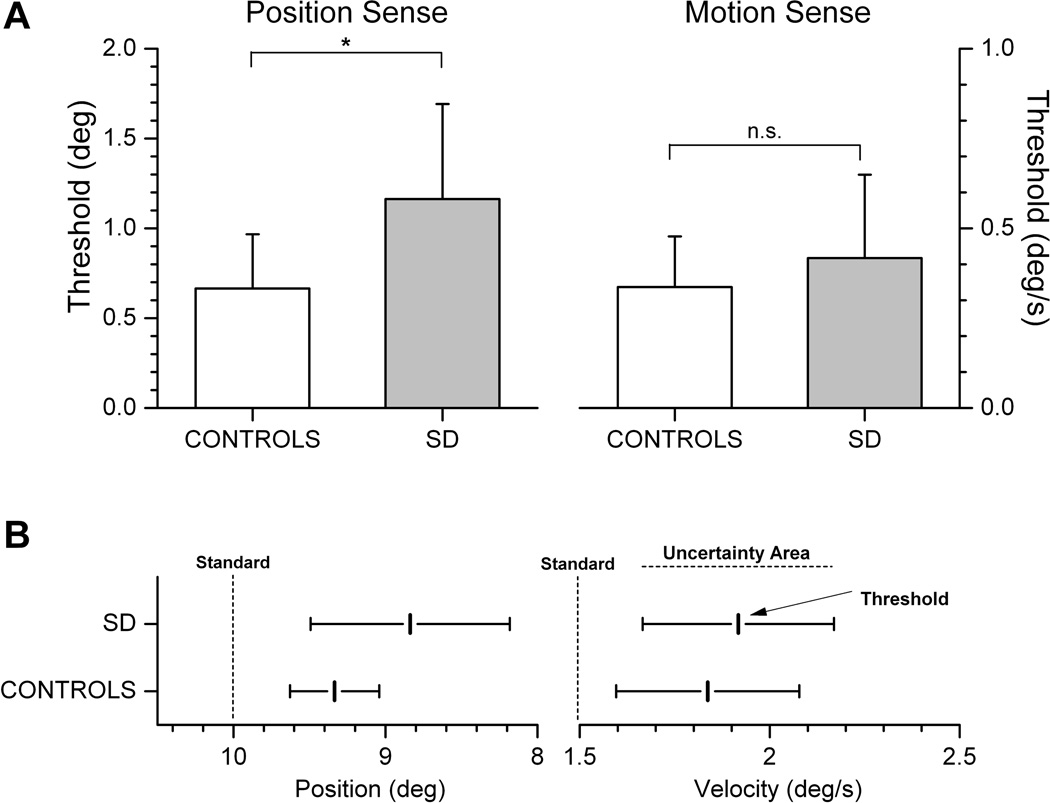
Fig. 3.
A. Mean thresholds for position and motion sense for both groups. Mean JND was significantly larger for position, but not for motion sense. Error bars represent 1 standard deviation (* = p < 0.01; n.s. = not significant). B. Mean JND and mean UA for position and motion sense in relation to the tested standards (10° and 1.5°/s). The comparison stimuli for position sense testing were always smaller than 10°, for motion sense testing stimuli were always larger than 1.5°/s.

