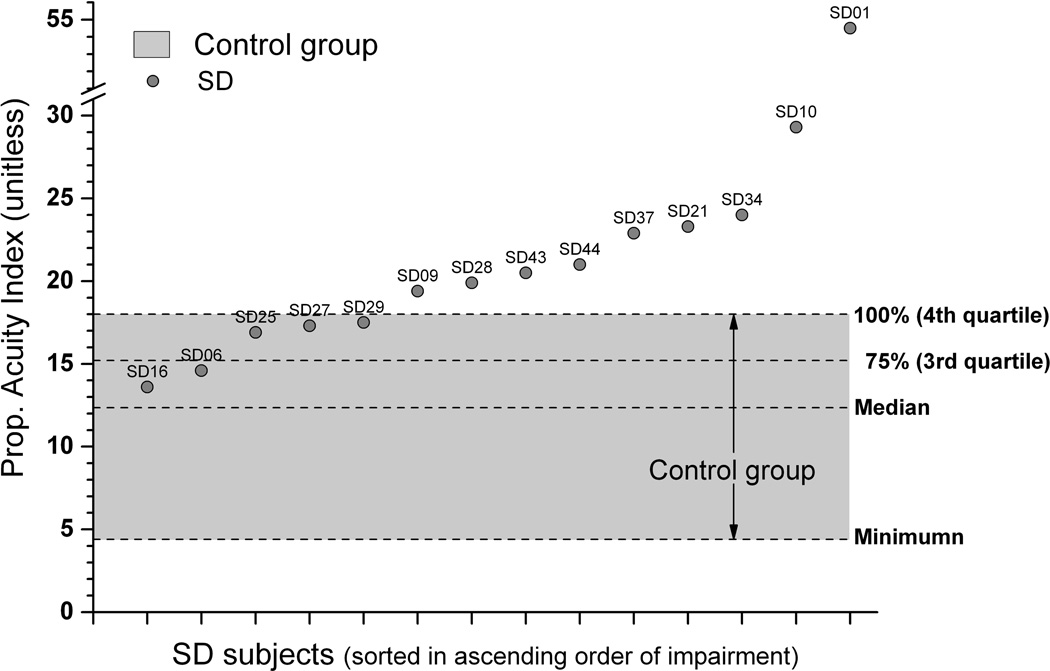
Fig. 4.
Proprioceptive acuity index for position sense. Data points represent PAI values of each SD subject (for better readability sorted in ascending order). The shaded area represents range of observed PAIs for the control group. Note that 9 SD subjects had PAIs above the maximum of the control group. No SD subject had PAI values below the control group median, indicating that the SD sample revealed an overall elevated shift in acuity.

