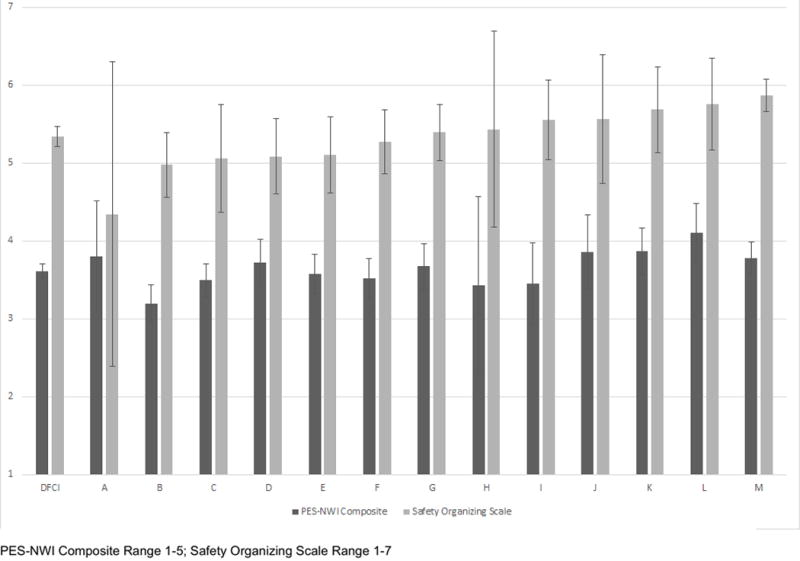
Figure.

Variation in Safety Organizing Scale and PES-NWI composite scores by unit or satellite. Unit-level means of the PES-NWI composite scale (dark gray) and the Safety Organizing Scale (light gray) are displayed for each unit, with corresponding 95% Confidence Intervals. The first paired columns on the left reflect the mean values for the entire institution. Corresponding units differ significantly from the institutional mean on both the PES-NWI and the Safety Organizing Scale.
