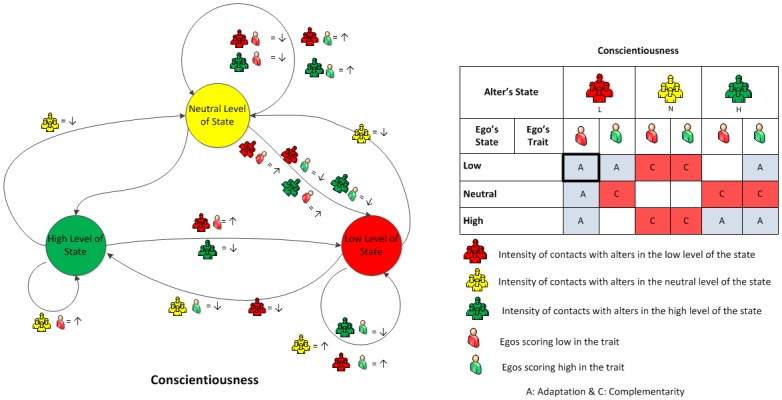
Fig 2.

(Left) Transition graph for conscientiousness: Nodes represent conscientiousness level of the ego. Arrows represent transitions from one level to another. Transitions are labeled with conditions that affect the corresponding probabilities. Icons represent the conscientiousness levels of alters and ego’s trait level. Symbol ↑ (respectively ↓) indicates an increase (respectively decrease) in transition probability associated with the given combination of alters’ state level and ego’s trait level. For example, if the ego high in the conscientiousness state, then the probability of the ego transitioning to the high level decreases with ego’s contact with alters in the neutral level of the state. Another example is the transition from neutral to low level of conscientiousness, which is moderated by the ego’s trait score. If the ego is high in trait, then the probability of transition from a neutral state to a low state decreases with his contact with alters in high and low levels. But if the ego is low in the trait, then the probability increases instead. (Right) Social influences: The table summarizes the level transition graph by means of adaptation (A) and complementarity (C). Rows represent ego’s state levels; columns are labeled with alters’ state levels and sub-labeled with ego’s trait level (Low or High). Cells report the effects observed when egos in the corresponding state level and trait level interact with alters in the corresponding state level. For example, the square with thick border indicates that when the ego is low in conscientiousness state and also low in conscientiousness trait, contact with alters who are also low in conscientiousness state results in an adaptation effect. Empty cells lack statistically significant effects in a given combination.
