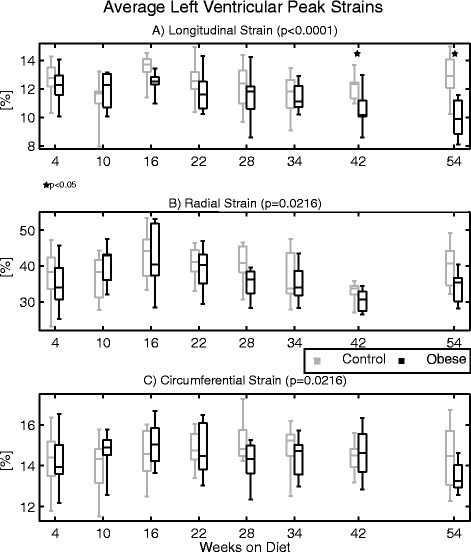
Fig. 4.

Average left ventricular peak strains at baseline in the (a) longitudinal, (b) radial, and (c) circumferential directions at the indicated times with respect to diet initiation from experiment 1. All strains are reported as positive to facilitate visual comparison (i.e. lower strains imply impaired function). Linear mixed models reported significant differences between groups for all strain measures over time; however, only longitudinal strain was reduced in the obese group at individual time points by post-hoc analyses (denoted by stars)
