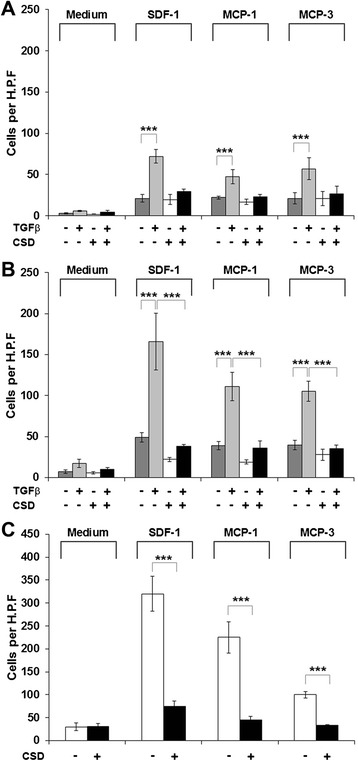
Fig. 3.

Migration toward various chemokines. Migration experiments were performed as described in the “Methods” section using C (a), AA (b), or SSc (c) monocytes. Cells were treated with TGFβ and CSD as indicated. Chemokines used as chemoattractants (and medium only control) are indicated. Data are expressed in terms of number of migrating cells counted per high power field. Bars show the mean level of migration ± SEM from four different subjects in each category determined in independent experiments. ***p < 0.002; **p < 0.01; *p < 0.05
