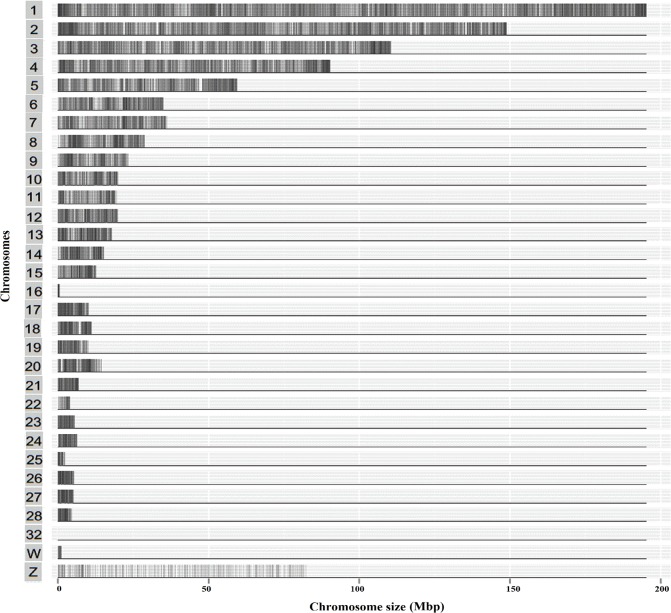
Fig 3. Distribution of the GGRS SNPs across the chromosomes.
The x-axis denotes the chromosome size (Mbp), and the y-axis indicates the chromosomes. If at least one SNP was present in each 10-kb genome block, we draw at least one grey lines on the special chromosome positions. If no SNPs are found in a block, we used a white color. Therefore, the deeper the color, the higher the number of SNPs.

