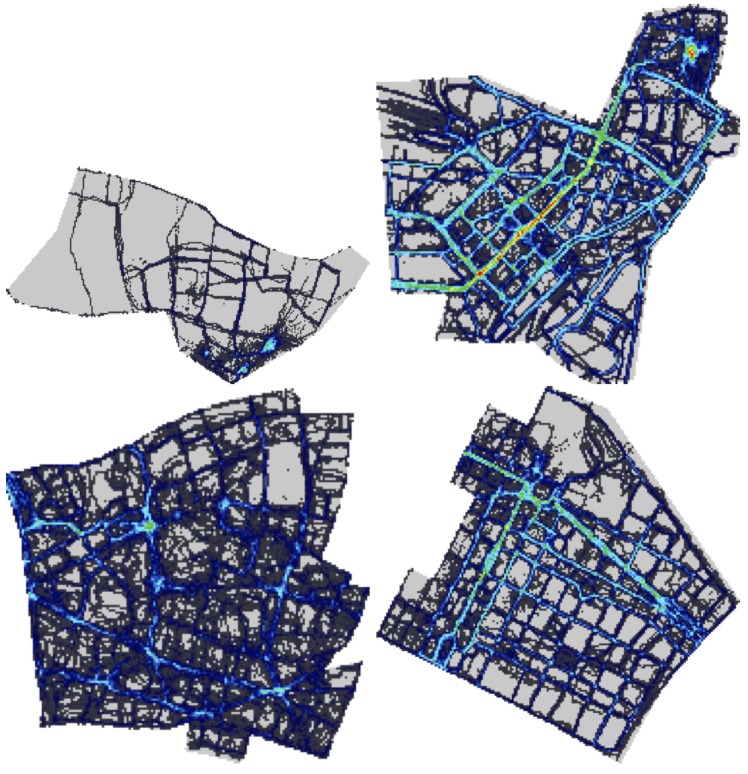
Fig 4. Coverage for phase two.
Heatmap representation of time and space coverage in the 4 cities after the second phase of the challenge. Red dots represent strongly covered tiles. Only the mapping area for each city is represented. The cities are, from top left to bottom right: Antwerp, Kassel, London and Turin.

