
Fig. 9.
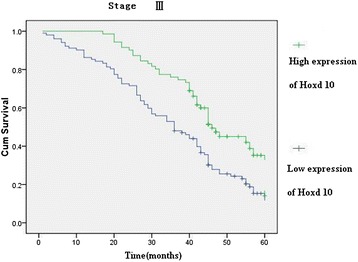
Kaplan-Meier curves with univariate analyses (log-rank) for patients with low Hoxd10 expression versus high Hoxd10 expression tumors in all gastric cancer in stage III
Official websites use .gov
A
.gov website belongs to an official
government organization in the United States.
Secure .gov websites use HTTPS
A lock (
) or https:// means you've safely
connected to the .gov website. Share sensitive
information only on official, secure websites.
Kaplan-Meier curves with univariate analyses (log-rank) for patients with low Hoxd10 expression versus high Hoxd10 expression tumors in all gastric cancer in stage III