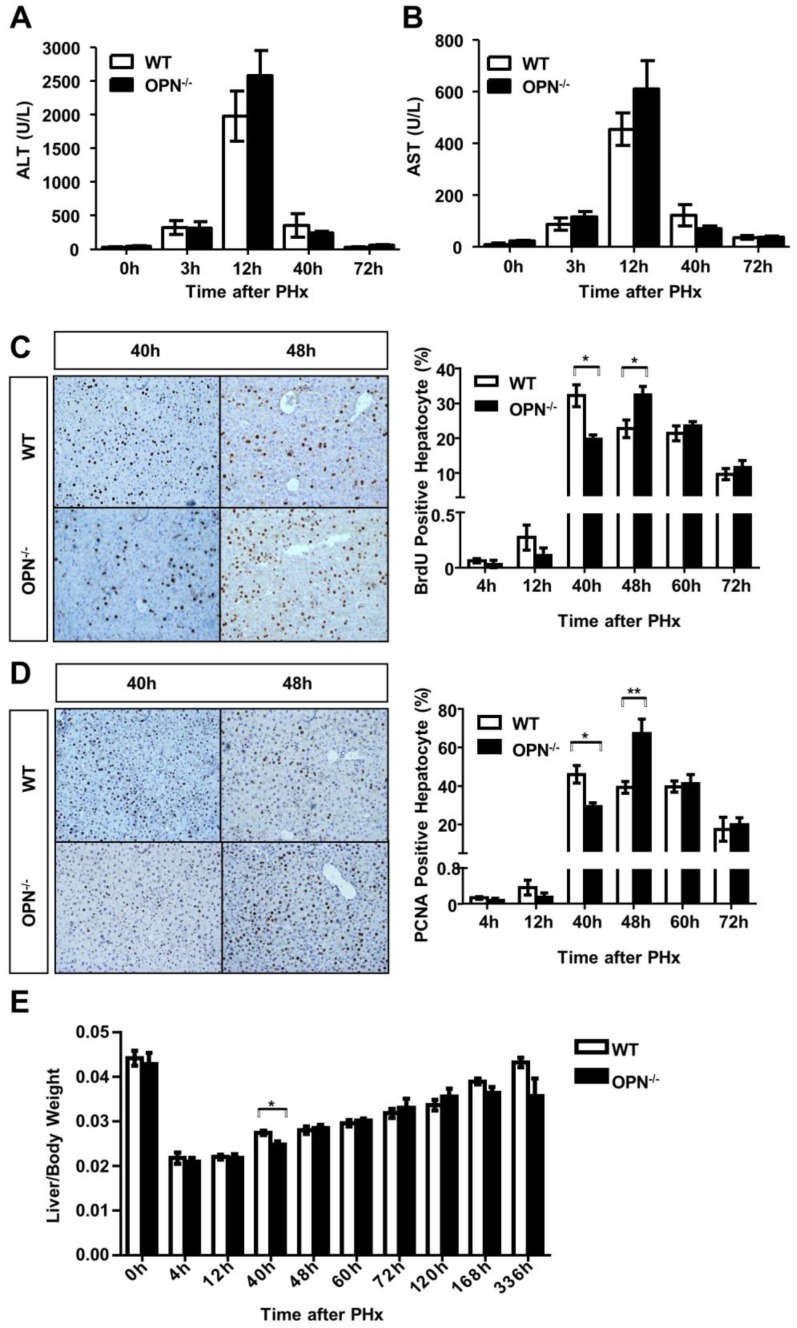
Fig 2.
OPN deletion delays the peak of hepatocyte proliferation during liver regeneration after PHx. (A) Serum ALT and (B) AST activities were determined at different time points after PHx (n = 3-8). The data are shown as the mean ± SEM. (C) BrdU incorporation were measured in liver sections at the indicated time points after PHx (200× magnification). Quantitative analysis of BrdU labeling was performed (n = 3-7). The data are shown as the mean ± SEM. *P<0.05. (D) PCNA immunolabeling in liver sections after PHx (200× magnification). The number of PCNA positive cells in remnant liver lobes was counted in at least 5 fields per liver section (n = 3-7). The data are shown as the mean ± SEM. *P<0.05, **P<0.01. (E) The liver-to-body weight ratio was determined at the indicated time points after PHx (n = 3-8). The data are shown as the mean ± SEM. *P<0.05.

