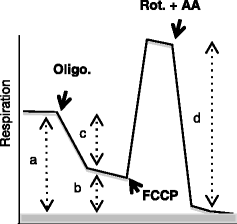
Table 1.
Respiratory control of Wt and Vdac1 −/− MEF
| Nx | Hx | |||
|---|---|---|---|---|
| Wt MEF | Vdac1 −/− MEF | Wt MEF | Vdac1 −/− MEF | |
| (a) Basal respiration | 20.52 ± 2.5 | 16.19 ± 1.8 | 4.5 ± 0.52 | 10.4 ± 2.41 |
| (b) Oligomycin-insensitve respiration (leak) | 5.96 ± 0.9 | 5.04 ± 0.9 | 2.4 ± 0.27 | 7.1 ± 2.73 |
| (c) Oligomycin-sensitive (ATP turnover) respiration | 14.56 ± 1.6 | 11.16 ± 0.8 | 1.8 ± 0.70 | 3.2 ± 0.95 |
| (d) Maximal respiration in the presence of FCCP | 29.21 ± 3.2 | 19.29 ± 1.7 | 5.4 ± 1.19 | 6.0 ± 0.29 |
| (c/a) Coupling efficiency | 0.71 ± 0.02 | 0.71 ± 0.01 | 0.4 ± 0.12 | 0.3 ± 0.13 |
| (d/b) Respiratory control ratio | 4.91 ± 0.2 | 3.95 ± 0.4 | 2.3 ± 0.71 | 0.8 ± 0.44 |
| (d-a) Spare respiratory capacity | 8.19 ± 1.2 | 3.10 ± 0.1 | 1.3 ± 0.50 | −5.4 ± 2.83 |

| ||||
The oxygen consumption rate (OCR) was measured in real time with a Seahorse XF bioenergetic system for Wt and Vdac1 −/−MEF in Nx or Hx. The average OCR was calculated from at least four measurements during treatment with each compound (oligomycin, FCCP, rotenone/antimycin A) at a 1 μM final concentration.
(a) represents basal respiration, (b) oligomycin-insensitive respiration, (c) oligomycin-sensitive respiration, and (d) maximal respiration in the presence of FCCP. The graph shows how to define a, b, c, and d. The mean ± SEM is representative of six independent experiments carried out in quadruplicate
