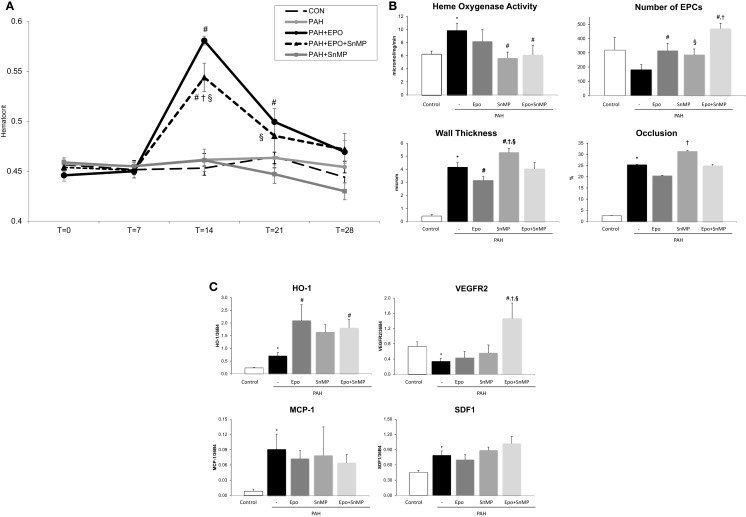
Figure 3.
(A) Hematocrit levels throughout the study time points at x-axis in days. Data are mean ± SEM. CON, control group, n = 10; PAH, untreated pulmonary arterial hypertension, n = 12; PAH + EPO, PAH treated with erythropoietin (EPO), n = 14. *p < 0.05 vs. CON, #p < 0.05 vs. PAH PAH + EPO + SnMP, PAH treated with EPO and tin-mesoporphyrin (SnMP), n = 12; PAH + SnMP, PAH treated with SnMP, n = 9. (B) Effects of HO activity blockade on HO activity, number of circulating EPCs and pulmonary vascular remodeling. CON, control group, n = 4–12; PAH, untreated pulmonary arterial hypertension, n = 8–14; PAH + EPO, PAH treated with erythropoietin (EPO), n = 5–15. PAH + EPO + SnMP, PAH treated with EPO and tin-mesoporphyrin (SnMP), n = 5–13; PAH + SnMP, PAH treated with SnMP, n = 6–10. (C) Effects of HO activity blockade gene expression. CON, control group, n = 5; PAH, untreated pulmonary arterial hypertension, n = 6; PAH + EPO, PAH treated with erythropoietin (EPO), n = 6. PAH + EPO + SnMP, PAH treated with EPO and tin-mesoporphyrin (SnMP), n = 6; PAH + SnMP, PAH treated with SnMP, n = 6.VEGF-R2, vascular endothelial growth factor receptor 2; SDF-1, stromal derived growth factor-1; MCP-1, monocyte chemoattractant protein-1. mRNA expression levels relative to 36B4 mRNA levels. Differences between the PAH and CON groups were analyzed using t-tests for normally distributed data and Mann–Whitney U testing for not normally distributed data. Differences between the untreated and treated PAH groups (groups 1–4) were tested by one-way ANOVA followed by Fisher’s protected LSD post hoc testing (hematocrit, hemodynamics, RV hypertrophy, and pulmonary vascular remodeling) and KruskallâĂŞWallis followed by MannâĂŞWhitney post hoc testing with Bonferroni correction (number of EPCs) was used. #p < 0.05 vs. PAH, †p < 0.05 vs. PAH + EPO, §p < 0.05 vs. PAH + SnMP.

