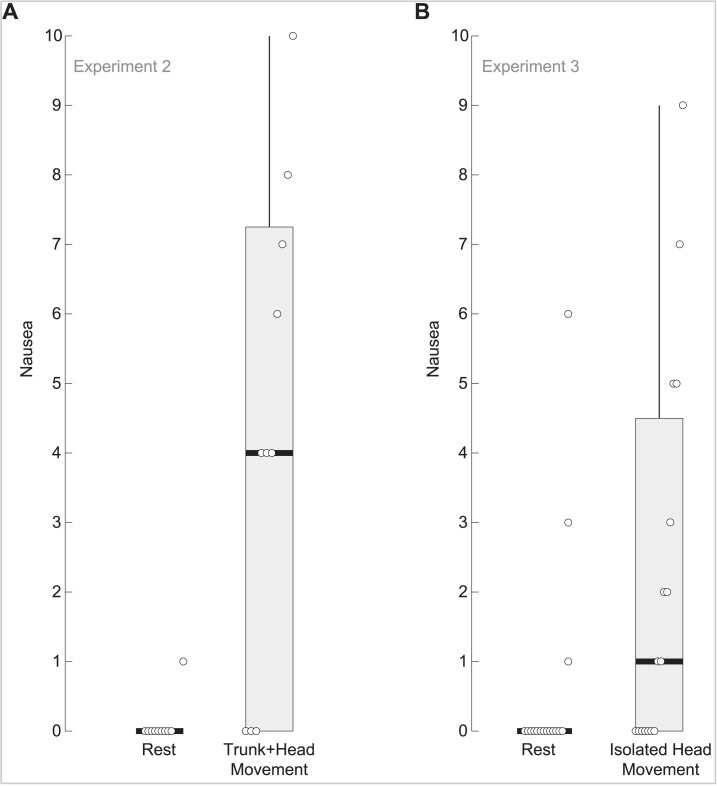
Fig 3. Effects of head-trunk and isolated head movement on nausea with remifentanil administration (cross-over design).
Median (horizontal bold line) and interquartile range (box) of nausea values quantified on a numerical scale from 0 (“everything okay”) to 10 (“vomiting”) in paradigms “rest” (left) and “head-trunk/head move” (right). Data of each subject is shown by a white dot. A: Experiment 2, head-trunk movement led to a marked increase in nausea (p = 0.008, related samples Friedman’s ANOVA by ranks). B: Experiment 3, isolated head movement led to a marked increase in nausea (p = 0.005, related samples Friedman’s ANOVA by ranks). The difference in nausea rating between the “rest” and “head-trunk/head move” conditions were not different for the groups who performed head-trunk or isolated head movement (Independent samples Mann-Whitney U test, p = 0.068).

