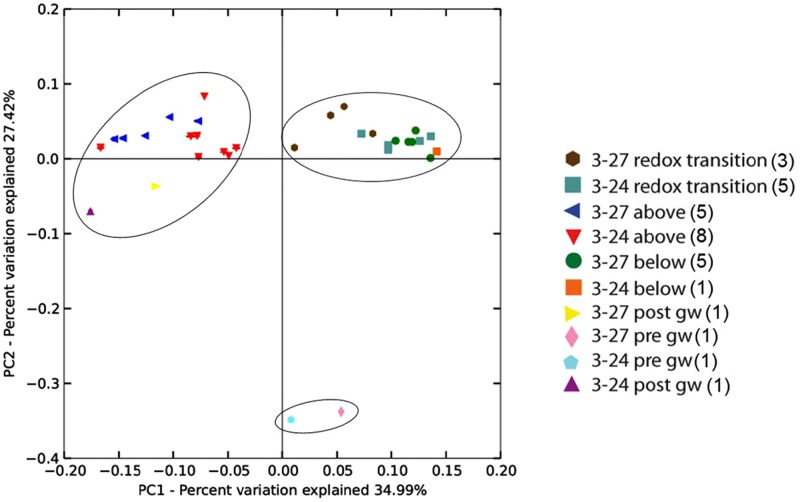
FIGURE 3.
Weighted Unifrac principal components analysis of 16S rRNA gene sequences from groundwater and grouped mineral deployments constructed from jackknifed beta diversity analysis. The number of sequences per sample was normalized to n = 2000. Values in parentheses in the symbol legend indicate the number of samples included in that groupling. The circles indicate the three clusters of samples, which were determined to be statistically different with ANOSIM (R = 0.818). There was no significant similarity between samples from different deployment types (R = 0.314).

