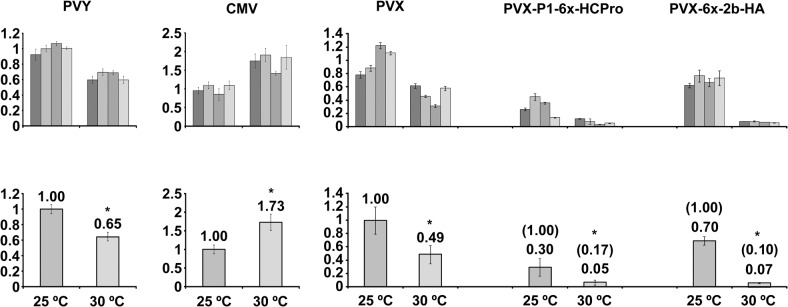
Fig 2. Assessment by RT-qPCR of genomic viral RNA levels in systemic tissue of Nicotiana benthamiana plants infected at either 25°C or at 30°C and standard (st; 401) parts per million (ppm) CO2 levels with Potato virus Y (PVY), Cucumber mosaic virus (CMV) or a Potato virus X (PVX) vector, the latter either unaltered or expressing the Cucumber mosaic virus (CMV) 2b protein or the PVY P1-HCPro bicistron.

The upper charts show the measurements for separate individual plants, while the lower charts show the mean values with standard deviation bars, relative to viral RNA levels of PVY, CMV or the PVX constructs at 25°C, which were given an arbitrary value of 1. In the cases of the PVX vectors expressing heterologous viral suppressors, their accumulation values at 30°C relative to their accumulation at 25°C appear between brackets, while their values relative to those of PVX at 25°C, appear below. The amplified viral RNA fragments correspond to genomic RNAs, in the case of CMV to genomic RNA 3, and do not contain subgenomic sequences. Asterisks in charts indicate significant differences (Mann Whitney U-test, P<0.05).
