
Figure 1.
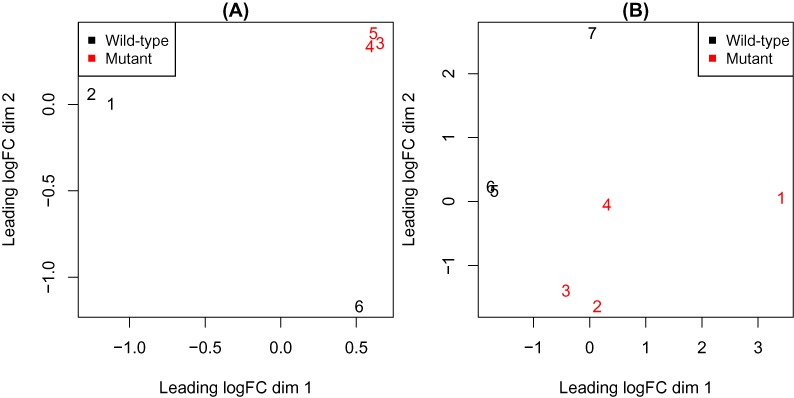
RNA-seq data sets where variations in sample quality are evident. Each panel shows a multi-dimensional scaling (MDS) plot, with samples colour-coded by experimental group. One or more samples that exhibit higher variability than average are present in each case ((A): sample 6; (B): samples 1 and 7). In these experiments, cells carrying a mutant allele of the gene Smchd1 were compared against wild-type cells.