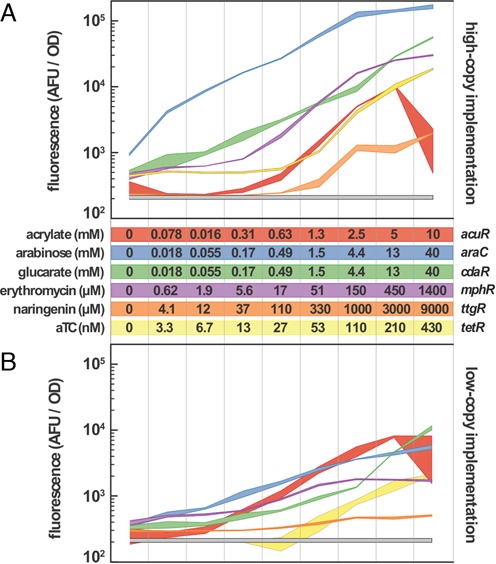
Figure 1.

Induction dynamics for each of the inducible systems are reported. The relationship between fluorescent response and inducer concentration is represented as a 95% confidence band (n = 3) for both the high-copy (A) and low-copy (B) implementations of the inducible systems. The plots are log scale to capture the wide range of inducer concentrations and biosensor responses. Inducer concentrations are the same for both high and low-copy implementations. Each curve is matched to a color-coded table of inducer concentration ranges. Acrylate and anhydrotetracycline (aTC) increase in 2-fold increments while arabinose, glucarate, erythromycin and naringenin increase in 3-fold increments. The inducing chemical and biosensor name are indicated to the left and right of the table, respectively. The gray band is the fluorescent response of a control strain containing no fluorescent reporter. Fluorescence measurements are performed 15 h after addition of the inducing chemicals.
