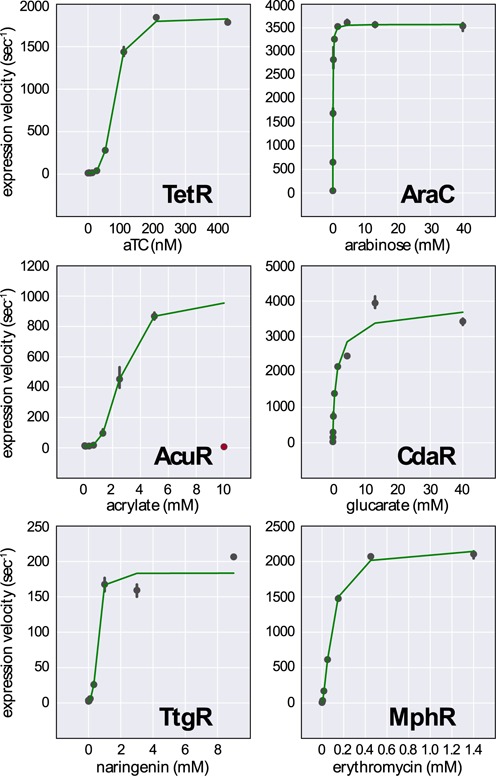
Figure 3.

High-copy promoter activity was fit to a model of inducible gene expression. The maximum expression velocity of each inducible promoter was determined at various levels of induction (points). The data was fit to a Hill function modified to account for basal and maximal promoter activity (green lines). The anhydrotetracycline (TetR), acrylate (AcuR) and naringenin (TtgR) biosensors all show high induction cooperativity. The arabinose (AraC), glucarate (CdaR) and erythromycin (MphR) biosensors show low or moderate levels of cooperativity. The 10 mM acrylate induction condition was omitted from the modeling data due to high toxicity (red point). Error bars reflect the 95% confidence interval for the measured expression velocity.
