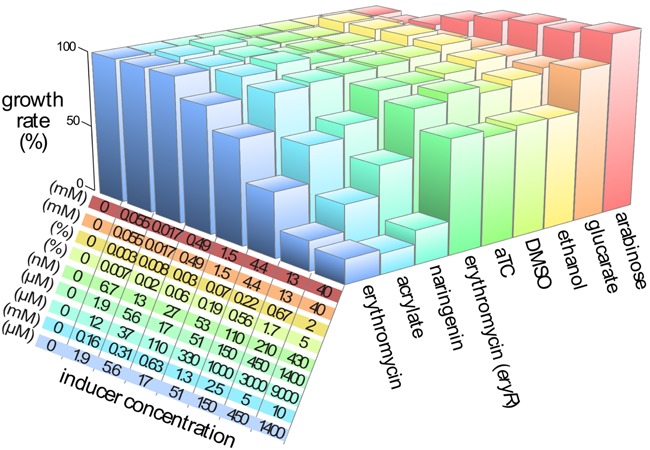
Figure 5.

The toxicity of each inducer chemical was evaluated over a wide range of concentrations. Growth rate was measured for each combination of chemical and concentration during the exponential phase of growth. Rates were normalized to the growth rate of cells without any added chemical and plotted as bar height. Concentration of each inducer is indicated in the table, corresponding to the bar chart by order and color. Ethanol and DMSO were included as they are the solvents for aTC and naringenin, respectively. Erythromycin was evaluated twice: with and without the erythromycin resistance gene, eryR. Inducer concentrations mirror the concentrations used in the induction experiments.
