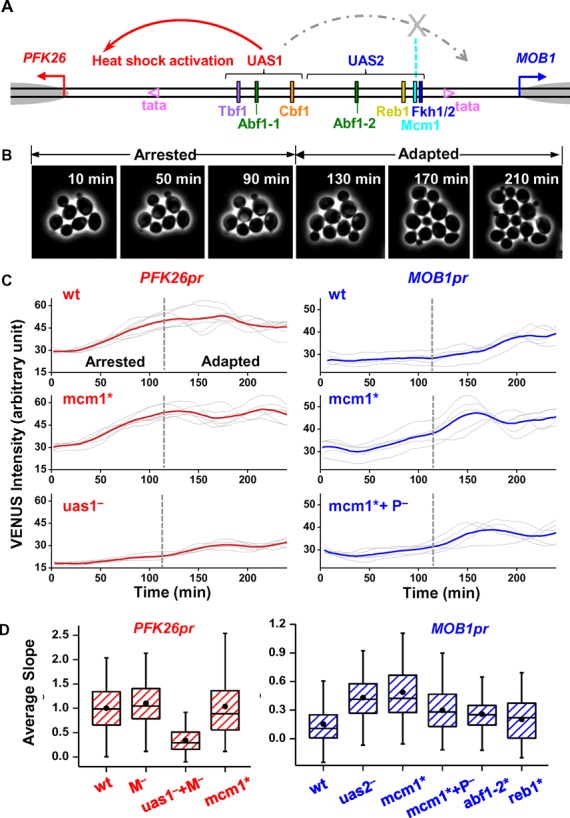
Figure 3.

Mcm1 ‘blocks’ the heat shock signal from UAS1 to MOB1. (A) The same as Figure 2A except showing the decoupling of heat shock activation: UAS1 induces heat shock activation of PFK26, but its effect on MOB1 is blocked by Mcm1. (B) Time-lapse images showing two stages of yeast growth during heat shock. During the first ∼120 min after heat shock, yeast experiences cell-cycle arrest (arrested phase). The cells then adapted to high temperature and resumed cell-cycle (adapted phase). (C) Typical traces of VENUS expression driven by PFK26pr (left panels) or MOB1pr (right panels) under heat shock condition. Each gray trace represents the VENUS intensity in a single cell during the first 4 h of heat shock, and the red / blue curves are the average of the gray traces. Vertical dashed lines are the boundaries between the arrested and adapted phases. The promoters are either wt (upper panels), or mutated. P−/M−: deletion of the PFK26/MOB1 side of the promoter up to the boundary between UAS1 and UAS2. (D) Box plots of the heat shock intensity driven by wt PFK26-MOB1 promoter and its variants. This intensity is calculated based on the slope of the heat shock traces during the arrested phase (‘Materials and Methods’ section). All data in this plot were normalized to that of the wt PFK26pr.
