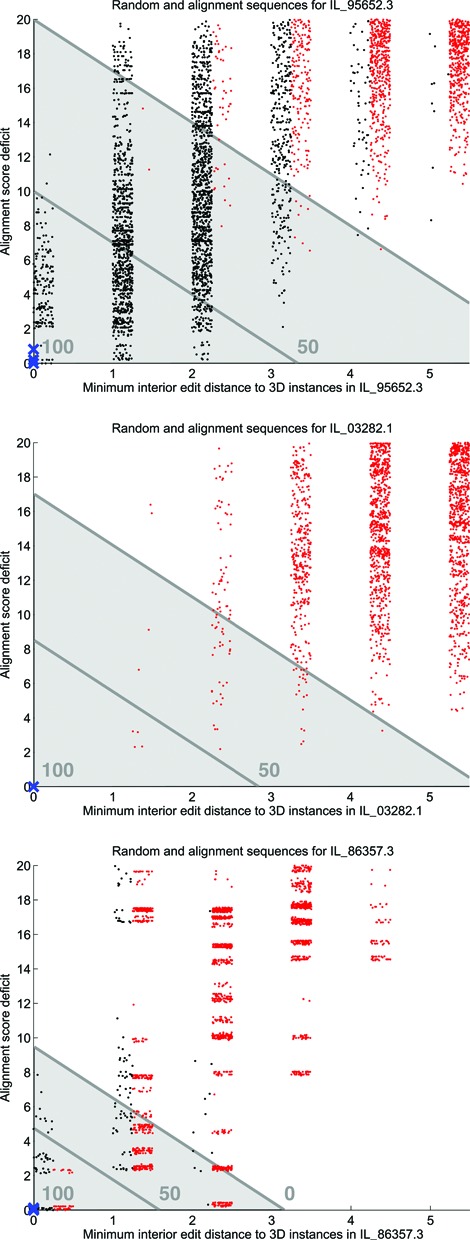
Figure 5.

Scatterplots of alignment score deficit against interior edit distance for motif group IL_95652.3 (top), IL_03282.1 (center) and IL_86357.3 (bottom). Red dots are from IL_Rand, black dots are from multiple sequence alignments and large blue X's are from 3D instances. A uniformly distributed random number is added to the interior edit distance for each dot to aid in visualization. The acceptance region is shown in light gray, and Cutoff scores 0 and 50 are shown by the darker lines; Cutoff score 100 is at (0,0).
