
Figure 5.
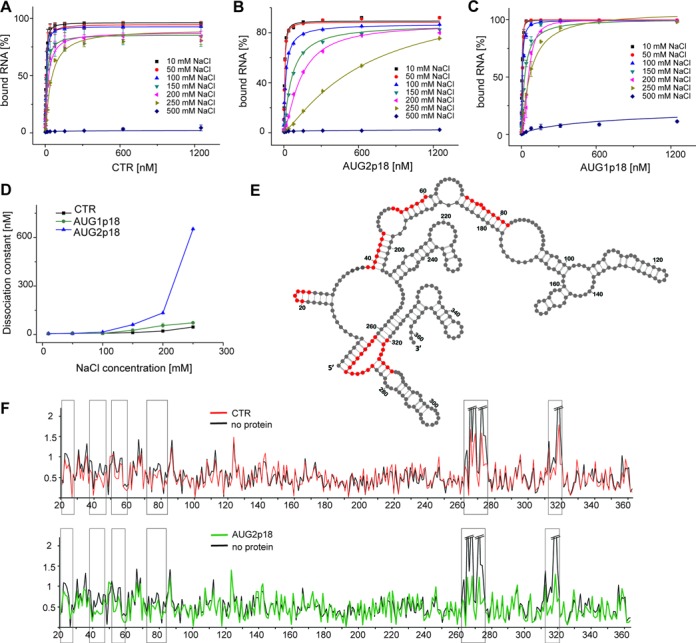
RNA binding properties of CTR, AUG2p18 and AUG1p18 proteins. Data plots of the filter-binding assay performed in different concentrations of NaCl (10–500 mM) for Ty1 mini RNA and (A) CTR, (B) AUG2p18 and (C) AUG1p18. The lines correspond to the best fit of the data. (D) Data plot of the dissociation constant measured for CTR, AUG2p18 and AUG1p18 as a function of NaCl concentration. The error bars represent standard deviations. (E) 2D structure model of +1–362 region (35) of Ty1 mini RNA with the positions protected from hydroxyl radical cleavage in the presence of the Ty1 Gag derived proteins marked (red). (F) Reactivity plots of protein free Ty1 mini RNA (black) in comparison with RNA probed in the presence of CTR (red) and p18 (green). Regions showing consistent increased reactivity over several nucleotides are boxed.