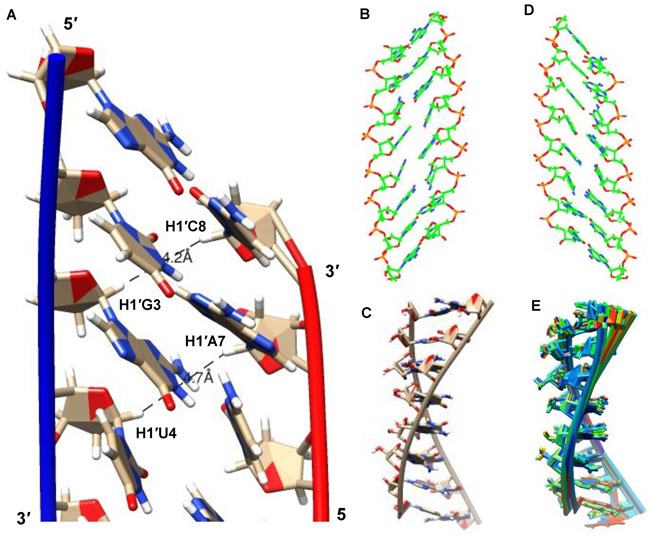
Figure 7.

Structural representations of the XyloNA duplex as determined by NMR structural analysis, (A) a close view of the minimum energy closest-to-average structure showing base stacking interactions and the proximity of the diagonal anomeric protons as observed in the NOESY spectra, (B) view from the minor groove, (C) side view with highlighted backbone, (D) view from the major groove, and (E) an overlay of 20 refined structures representing convergence in the structure calculation.
