Figure 1.

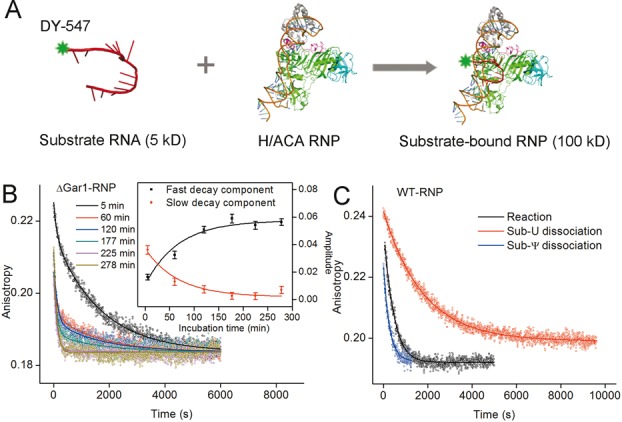
Catalytic modification rates measurement using FA. (A) Schematics of substrate RNA and RNP binding process. The large difference in molecular weights leads to a large difference in FA. The fluorescent dye DY547 is attached to the 3′-end of substrate RNA. (B) Dissociation curves after 4000-fold dilution of the Sub-U/ΔGar1-RNP reactive complexes which had been incubated for different times at 27°C. All curves were globally fitted to a double-exponential function. The two amplitudes were plotted against the incubation time and globally fitted to a single-exponential function to determine the catalytic modification rate (inset). (C) Dissociation curves of the Sub-U/WT-RNP reactive complex (black), Sub-U/D85A-RNP complex (red) and Sub-Ψ/WT-RNP complex (blue) at 22°C. The curves of Sub-U/D85A-RNP and Sub-Ψ/WT-RNP complexes were fitted to a single-exponential function respectively to derive dissociation rates of Sub-U and Sub-Ψ. Catalytic modification rate was determined by fitting the curve of Sub-U/WT-RNP complex to a double-exponential function with the dissociation rates of Sub-U and Sub-Ψ fixed.
